
What this benchmark is trying to answer
Opening Docker Desktop proves that the software starts. It does not show whether a small PC can run a web server, relational database and cache together, stay responsive under mixed load or recover its data after a restart. This lab uses nginx, PostgreSQL 17 and Redis 8 to answer those narrower questions on the Core i3-1215U EQi12.
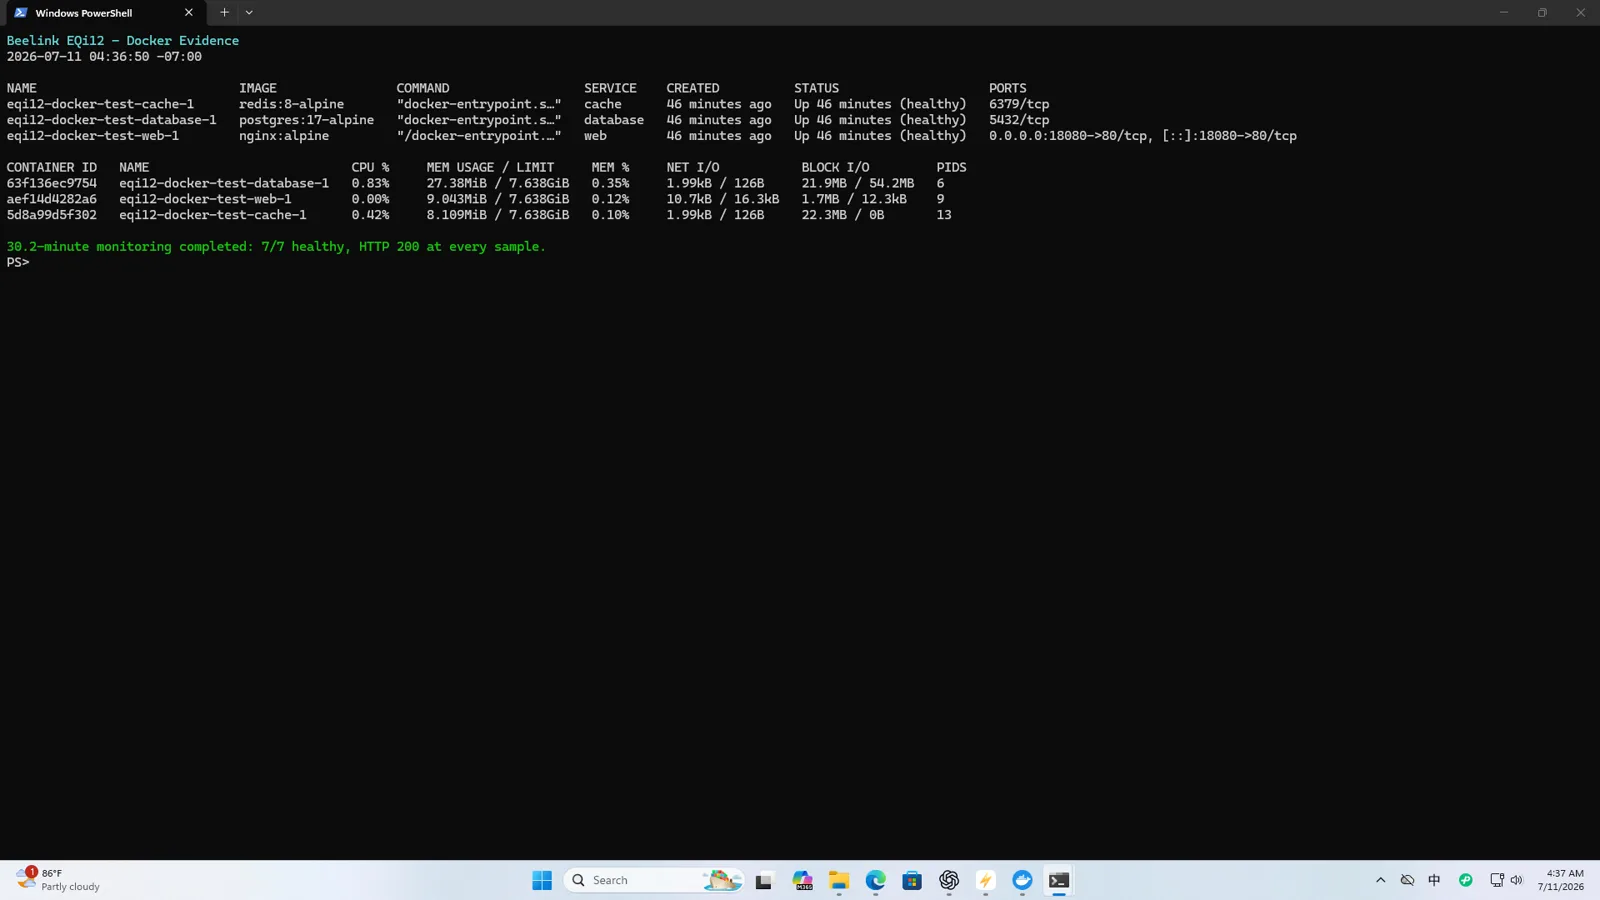
The stack ran through Windows 11, WSL2 and Docker Desktop. Each service was tested in isolation, then nginx and PostgreSQL were loaded together while Redis remained part of the active stack. Temporary database and cache data were isolated and cleaned up afterward. Container health, errors, host CPU and restart counts were recorded along with throughput.
These are localhost synthetic results. They remove internet latency and do not include a real framework, TLS, authentication, user sessions or complex queries. The useful conclusion is about the tested host and stack, not a claim that a public site will serve the same number of users.

Test platform and service layout
The host contained an Intel Core i3-1215U with six cores and eight threads, 16GB DDR4-3200 and a 512GB WD PC SN540 NVMe SSD. Docker used the WSL2 backend. The benchmark services were lightweight Alpine-based images where available:
- nginx serving a static local response;
- PostgreSQL 17 with a temporary
pgbenchdatabase at scale 10; - Redis 8 using isolated database 15;
- host monitoring for CPU, container health and restart state.
Jellyfin was part of the wider server installation but was not included in the web-stack score. Keeping its results separate prevents media transcoding from becoming an undocumented variable in the database and HTTP tables.
Corrected nginx method
The final nginx runner used asynchronous requests against a static local endpoint for 15 seconds at concurrency 10, 50 and 100. It recorded request rate, average latency, P95 latency and errors.
| Concurrency | Requests per second | Average latency | P95 latency | Errors |
|---|---|---|---|---|
| 10 | 6,155.81 | 1.619ms | 2.908ms | 0 |
| 50 | 10,374.33 | 4.816ms | 9.078ms | 0 |
| 100 | 10,629.74 | 9.403ms | 17.224ms | 0 |
Throughput climbed sharply from concurrency 10 to 50, then approached a plateau at 100 while latency increased. That is a normal saturation pattern: more simultaneous work raises total throughput until a resource becomes constrained, after which queueing adds latency.
The 100-concurrency result is not a ten-thousand-user forecast. A real request may involve TLS, a database query, template rendering, storage and upstream services. Static localhost nginx is useful as a repeatable host/container baseline and a way to detect a serious regression after an update.

Why the first nginx run was rejected
The first implementation issued synchronous requests through a limited client thread pool. At higher concurrency, the load generator blocked itself and became the bottleneck. Low throughput from that run described the client code, not the nginx container.
The diagnostic signs were inconsistent scaling and a client implementation that could not keep the requested operations in flight. The test was rewritten with asynchronous I/O, rerun under the same published durations and labeled FIXED. The earlier output remains in the private archive so the correction can be audited, but it is not averaged into the final table.
This matters beyond one benchmark. When a tiny server appears to collapse at higher concurrency, check whether the load generator has enough CPU, sockets and asynchronous capacity. A test client on the same host can run out of resources before the service under test does.
PostgreSQL 17 results
PostgreSQL used pgbench with a temporary database at scale 10. Two client/thread combinations ran for 30 seconds.
| Clients / threads | TPS | Average latency | Failed transactions |
|---|---|---|---|
| 10 clients / 4 threads | 3,323.39 | 3.002ms | 0 |
| 30 clients / 6 threads | 4,384.85 | 6.830ms | 0 |
Increasing clients raised total transactions per second while more than doubling average latency. That trade-off is expected: higher concurrency uses more of the processor but also increases waiting. Zero failed transactions is as important as the peak TPS for this short workload.
pgbench scale 10 is not a substitute for an application’s schema or query plan. It is useful for comparing the same host before and after changes to Docker, storage, memory or power settings. Keep the scale, duration, client count and PostgreSQL version fixed for any later comparison.
Redis 8 results
Redis used isolated database 15 so benchmark keys could be removed without touching normal service data.
| Clients | SET requests/s | GET requests/s | P50 latency |
|---|---|---|---|
| 50 | 145,985.41 | 158,604.28 | about 0.15–0.16ms |
| 100 | 162,337.66 | 167,084.38 | about 0.30ms |
The 100-client run increased throughput modestly while approximately doubling median latency. For a home automation, cache or queue workload, these numbers indicate substantial local headroom. Networked clients, persistence policy, payload size and a real command mix will produce different results.

Mixed-load result
The most useful experiment ran the web and database work together. A home server rarely executes one isolated benchmark process; it serves requests while background services and databases remain active.
During the mixed run:
- nginx completed 468,828 requests with zero errors;
- nginx averaged 7,805.10 RPS;
- per-window nginx throughput ranged from 6,240.67 to 10,420.37 RPS;
- nginx average P95 latency was 14.313ms;
- PostgreSQL completed 2,082.95 TPS at 9.582ms average latency;
- PostgreSQL reported zero failed transactions;
- sampled host CPU averaged 63.42%;
- all three containers remained healthy with no restart or service interruption.
PostgreSQL throughput fell from its isolated best result and latency rose, while nginx remained responsive. That is the expected and valuable finding: the services competed for the same CPU and memory, yet the tested stack continued to complete work without errors.
The result supports a light self-hosted web application, database and cache on one EQi12. It does not define the maximum safe production load. A real deployment should leave capacity for backups, antivirus scans, Windows updates, log rotation and Jellyfin activity.
Host resource interpretation
An average sampled CPU value of 63.42% during mixed load suggests usable headroom, but averages can hide brief saturation. P95 latency and error counts therefore remain part of the conclusion. Memory pressure was not the limiting event in this run, and the NVMe storage was substantially faster than the 1GbE client path measured elsewhere.
For an application server, watch at least:
- host CPU and available memory;
- container restart counts and health state;
- HTTP error rate and P95/P99 latency;
- PostgreSQL failed transactions and slow queries;
- Redis latency, persistence status and evictions;
- disk space, SMART and backup completion.
A high requests-per-second screenshot without these signals can hide an unstable stack.
Stability outside the benchmark window
The broader service stack completed 12.57 hours of monitoring with about 150 samples. There were no HTTP failures, container-health failures, running-state failures or container restarts. Maximum sampled CPU was 52%, and minimum available memory was 5,472MB.
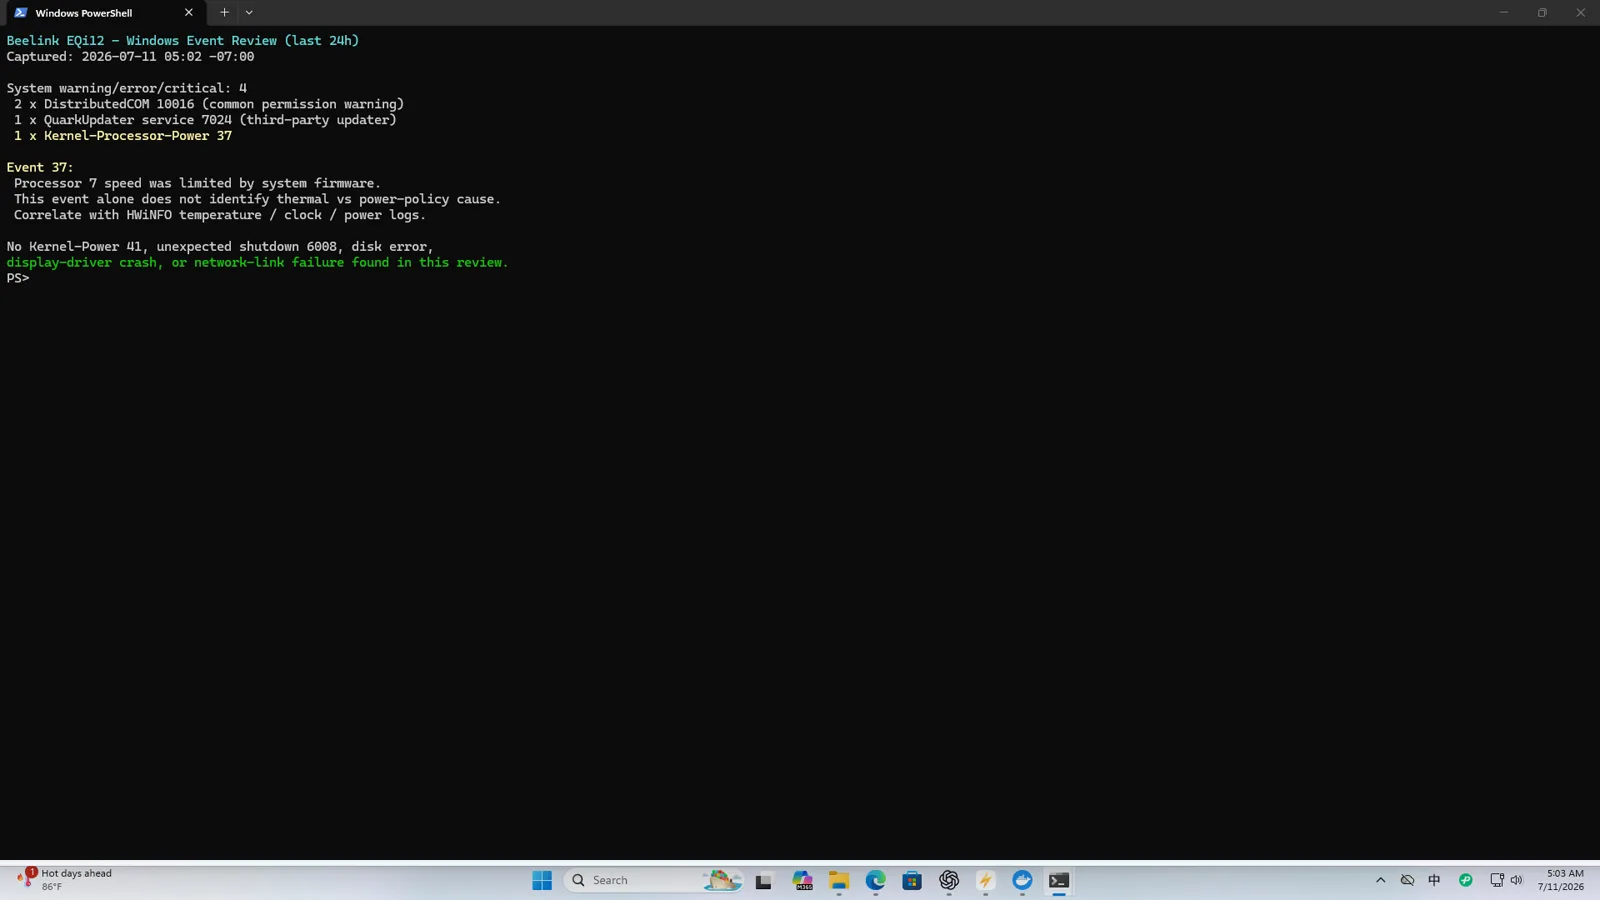
The two tests answer different questions. The benchmark shows short-duration capacity and contention behavior. The monitored run shows whether the normal stack remains available over a longer operating window.
Restart and recovery checks
Docker auto-start passed three repeated Windows restart cycles plus a configuration review. After recovery, nginx, PostgreSQL, Redis and Jellyfin-related endpoints were checked. The services did not require a manual Docker Desktop click to return in the recorded cycles.
Application-level recovery was also tested:
- nginx configuration reload passed in 0.660 seconds;
- a PostgreSQL marker survived restart and was confirmed after 0.833 seconds;
- a Redis marker survived restart and was confirmed after 2.042 seconds;
- PostgreSQL export and restore into a temporary database passed;
- Redis binary-safe backup and restore passed.
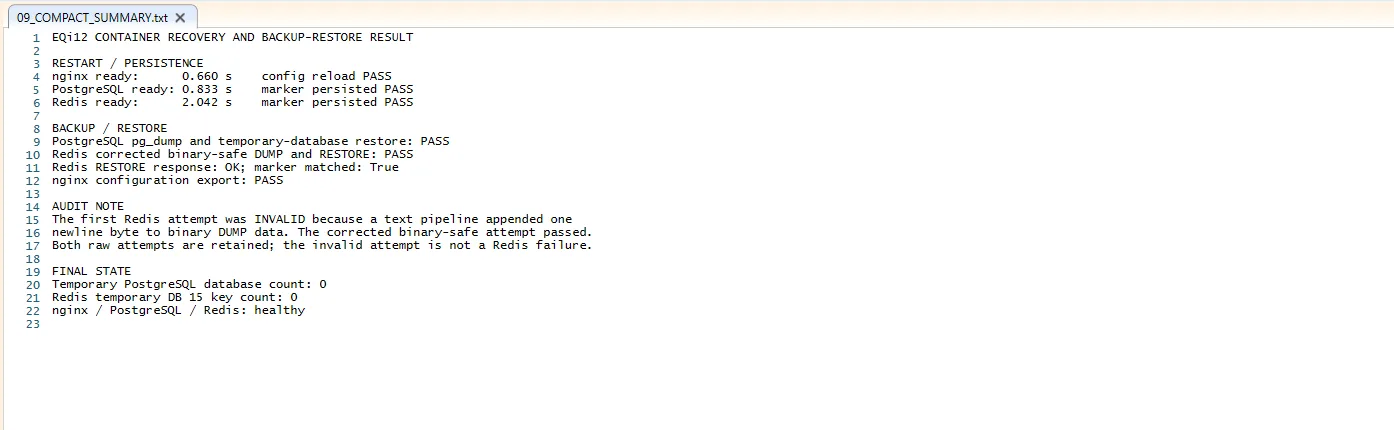
The initial Redis restore used a PowerShell text pipeline that altered the binary dump. That attempt was rejected and rerun with a binary-safe path. This is a method correction, not an EQi12 failure, and it is exactly why restore tests belong in a deployment plan.
Reproducing the benchmark responsibly
Keep the host and test definitions stable. Record Windows build, Docker Desktop and engine versions, WSL kernel, image tags, CPU power plan and background services. Pin the data set, duration, client counts and concurrency values. Run a warm-up, then several measured rounds rather than publishing the single highest number.
Use temporary databases and isolated Redis keys. Confirm cleanup afterward. Avoid simple passwords or broad firewall rules on any network beyond an isolated test LAN. If the client runs on the same host, monitor its CPU and thread behavior so it does not become the hidden bottleneck.
For comparisons with another mini PC, use the same images and scripts, and report errors and latency beside throughput. A faster best-case RPS with timeouts is not automatically a better server.
What the numbers mean for a home server
nginx has far more static-response capacity than a normal household needs. PostgreSQL and Redis also show ample headroom for small self-hosted applications. The limiting factors are more likely to be application design, memory growth, backups, external network speed and administrative discipline.
Sixteen gigabytes of memory is comfortable for this tested stack, but not unlimited. Add services gradually, set health checks and resource monitoring, and keep database data on application-aware backup schedules. If multiple memory-heavy services or virtual machines are planned, the hardware configuration should be reassessed before relying on benchmark headroom.
Bottom line
The EQi12 ran nginx, PostgreSQL 17 and Redis 8 together under substantial local synthetic load without request or transaction failure. Corrected nginx throughput reached 10,629.74 RPS in isolation and averaged 7,805.10 RPS during mixed work; PostgreSQL produced 2,082.95 TPS in the mixed run; sampled CPU averaged 63.42%. More importantly, services remained healthy, returned after restart and passed application-level backup checks.
Use these figures as a repeatable baseline for this hardware and stack, not as public-traffic marketing. Generate a starter stack with the Docker Compose generator, then follow the Docker Compose tutorial for the complete deployment workflow, the Docker auto-start guide, the Windows home-server build, or the 12.57-hour stability report.
Planning a self-hosted photo platform on this machine? The self-hosted Google Photos alternative sizing guide uses the PostgreSQL, Redis and storage numbers from this benchmark for capacity planning, with the component-level (not end-to-end) caveat spelled out.