
The exact duration
The monitored run started at 09:27:26 and the last sample was recorded at 22:01:34. The summary reports 12.57 decimal hours, equivalent to about 12 hours 34 minutes, with 150 samples.
The run was stopped after exceeding the requested 12-hour minimum. Its purpose was to catch service-health failures, container restarts, HTTP outages, memory pressure and obvious Windows errors under the configured home-server stack.
Samples were collected at roughly five-minute intervals. Each sample combined host resource data, container running/health state, restart counters and an HTTP check. That interval can detect sustained outages and restart events, but it is not a packet-level availability monitor; a very short failure between samples could be missed.
Monitored result
| Metric | Result |
|---|---|
| Actual duration | 12.57 hours |
| Samples | 150 |
| HTTP failures | 0 |
| Container health or running failures | 0 |
| Maximum combined restart count | 0 |
| Maximum sampled CPU | 52% |
| Minimum available memory | 5,472MB |
| Final live state | Three containers healthy, up 18 hours |
The final “up 18 hours” container age exceeds the monitored window because the containers were already running before the sampler started. The measured test duration remains 12.57 hours.
Pass and failure rules
The run would have failed if a required container stopped, a health check became unhealthy, the HTTP endpoint failed, a restart counter increased unexpectedly, available memory reached a critical floor, or the host recorded a relevant hardware or operating-system error. A high but brief CPU sample alone was not a failure; the service result and recovery behavior mattered more.
| Signal | Why it was monitored | Passing result |
|---|---|---|
| HTTP endpoint | Proves an application answered | No sampled failures |
| Container state | Separates process exit from app errors | Required containers running/healthy |
| Restart count | Catches crash loops hidden by restart policies | No increase |
| Available memory | Shows whether the stack approached exhaustion | Minimum remained 5,472MB |
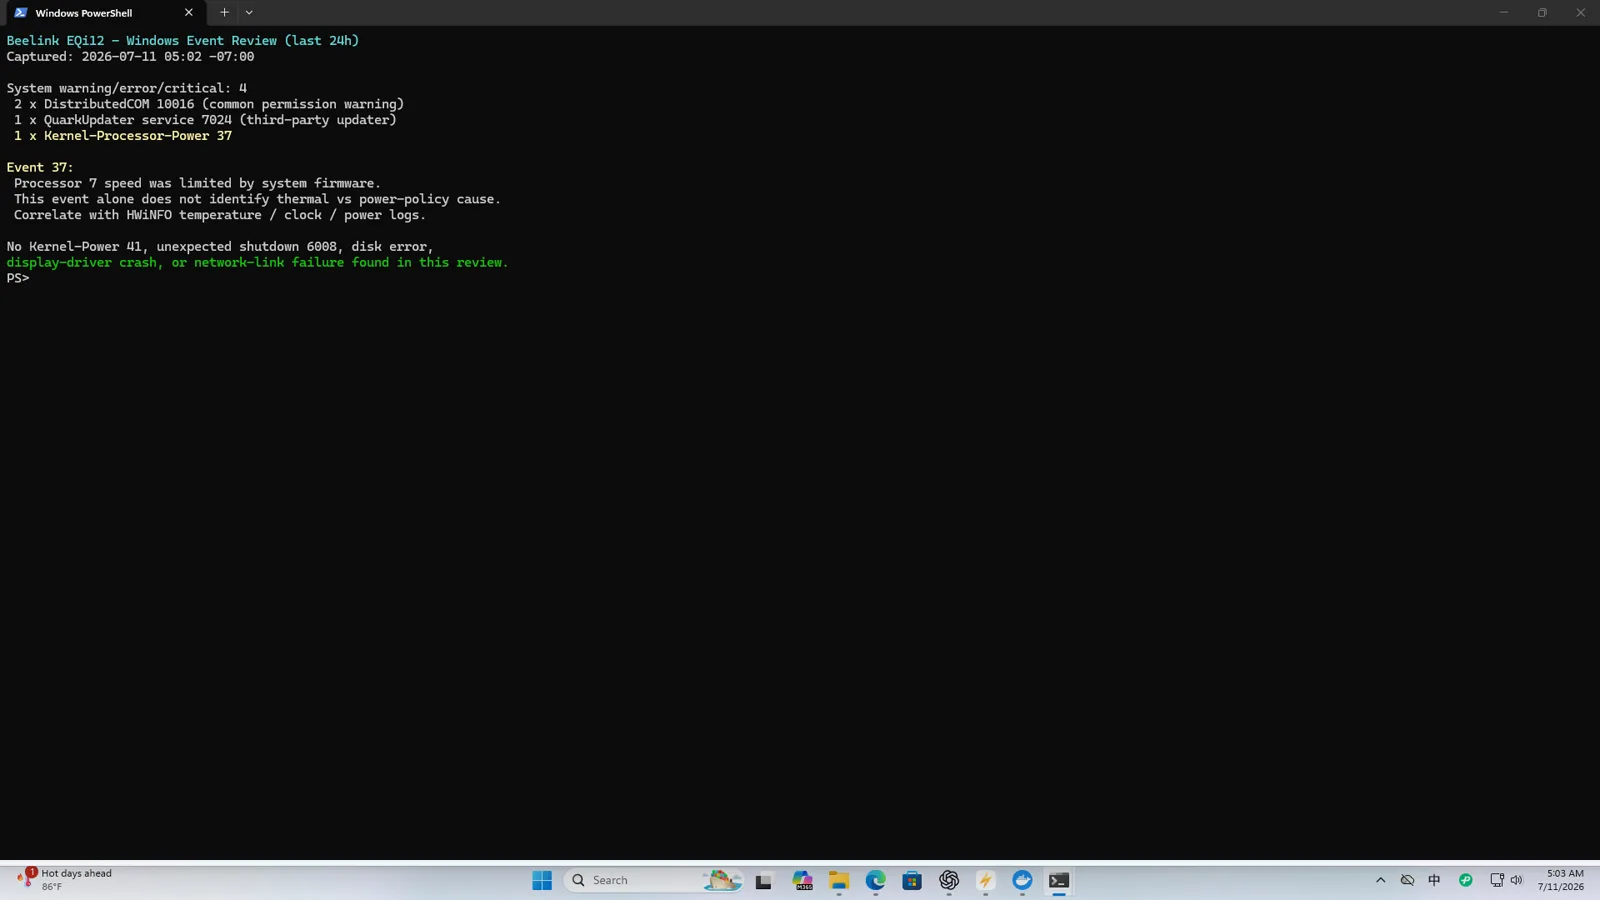
| Windows events | Looks beyond the container dashboard | No retained event changed the conclusion |
Restart and wake checks around the long run
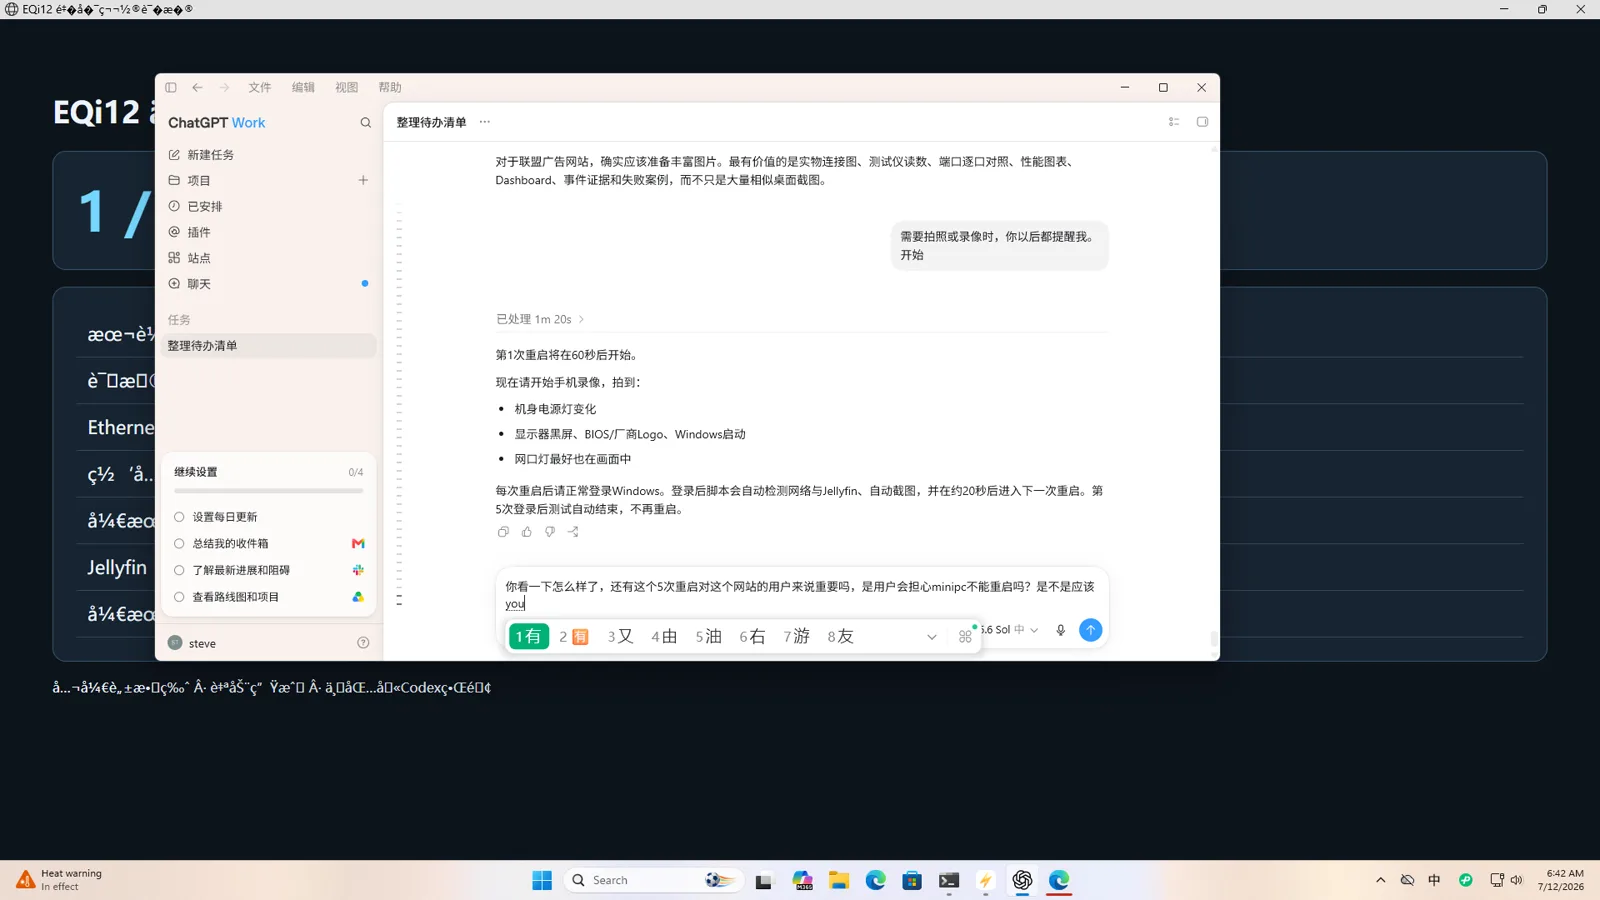
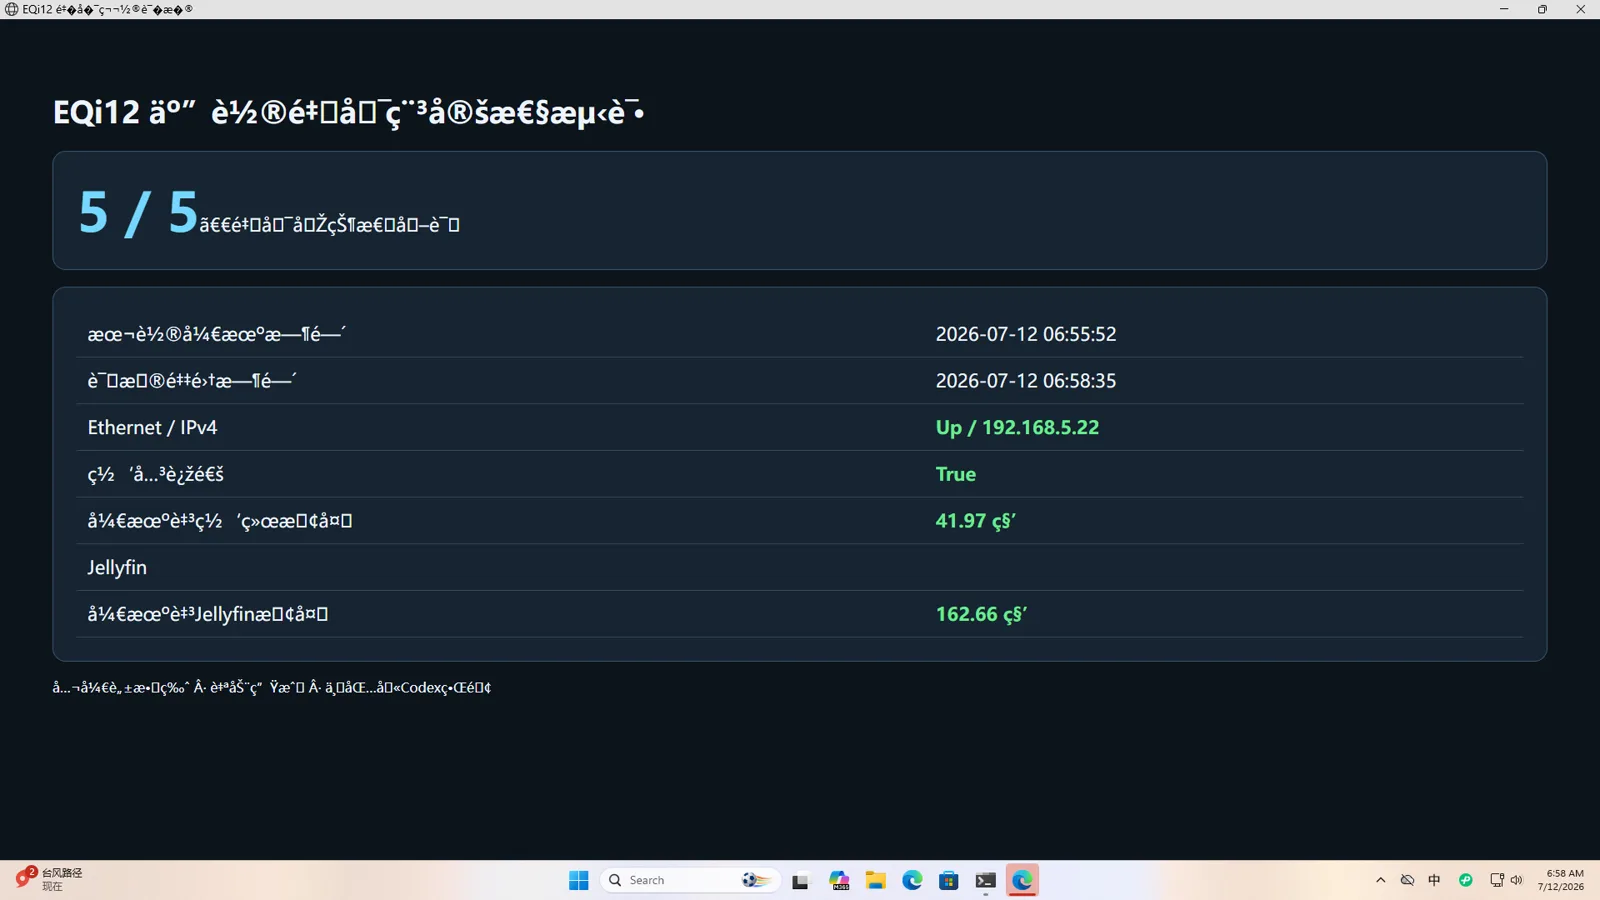
Normal restart passed five of five cycles. Shutdown Wake-on-LAN passed five of five. S3 sleep wake passed four of five, with one cycle requiring the power button. Automatic boot after restored AC power passed three of three.
Recovery above the container level
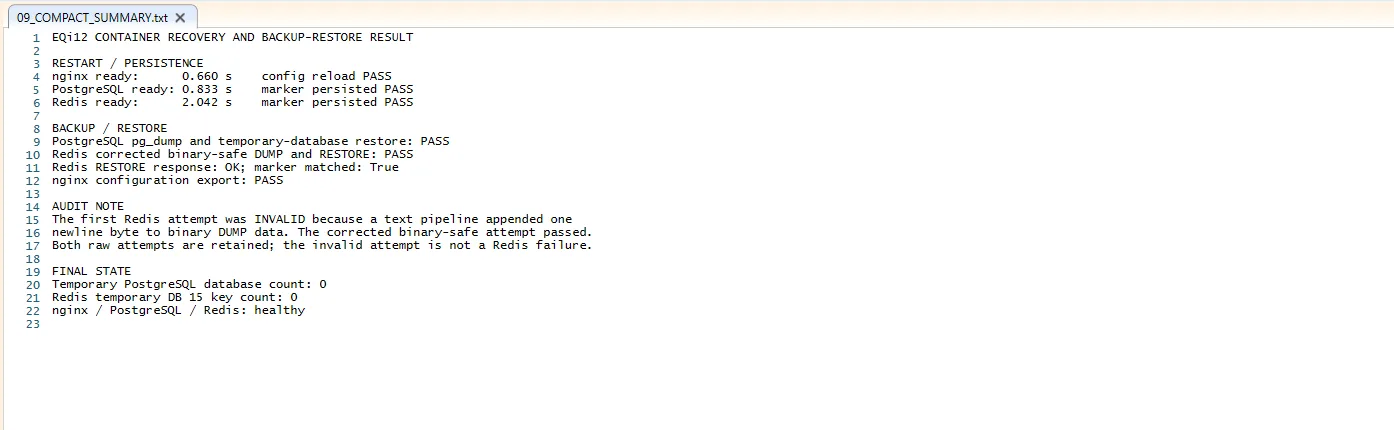
A healthy container after restart does not prove that application data can be restored. The recovery test therefore checked:
- nginx restart and configuration reload in 0.660 seconds;
- PostgreSQL readiness in 0.833 seconds with the marker retained;
- Redis readiness in 2.042 seconds with the marker retained;
- PostgreSQL pg_dump and restore into a temporary database;
- corrected binary-safe Redis DUMP and RESTORE;
- final healthy status and cleanup of temporary test data.
Memory and event checks
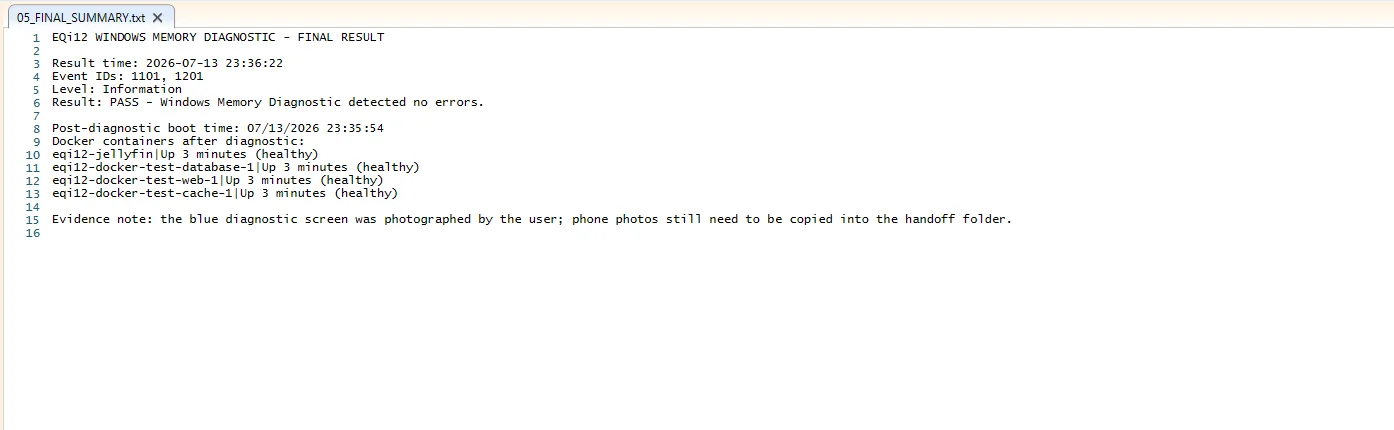
Windows Memory Diagnostic result events were captured separately. Event logs and present-device inventories were retained after testing so a clean container dashboard would not hide an operating-system or hardware-recognition problem.
What this proves and what it does not
The result supports calling the tested EQi12 a credible light Windows home-server host under this nginx, PostgreSQL, Redis and Jellyfin configuration. It applies to the recorded service stack over the measured 12.57-hour window.
A real deployment still needs scheduled backups, restore drills, update planning and monitoring from another device. Stability is a process, not a single screenshot.
The result does not equal a 24-hour, multi-day or burn-in certification. It also does not cover a native Linux or Proxmox installation. The defensible claim is narrower: this exact Windows, WSL2 and Docker stack completed the recorded 12.57-hour window without a sampled service or container failure.
Turn the test into ongoing monitoring
For a real home server, move the health check to another device so a host freeze cannot report itself as healthy. Alert on repeated container restarts, HTTP failure, low disk space, backup age and storage-health changes. Run a restore drill after major application or database upgrades, not only after replacing hardware.
Related evidence
See the workload details in the Docker benchmark and the reboot, WOL and AC-recovery results in the Windows home-server report.