
Test method
An external wall-power meter was placed between AC power and the EQi12 power supply. Readings were recorded from the physical meter and paired with the system state. The instrument displayed whole watts, so differences of one or two watts should not be overinterpreted.
These are observed state readings, not laboratory-grade long-duration averages. Background Windows activity, fan speed, screen output and workload timing can move the number.
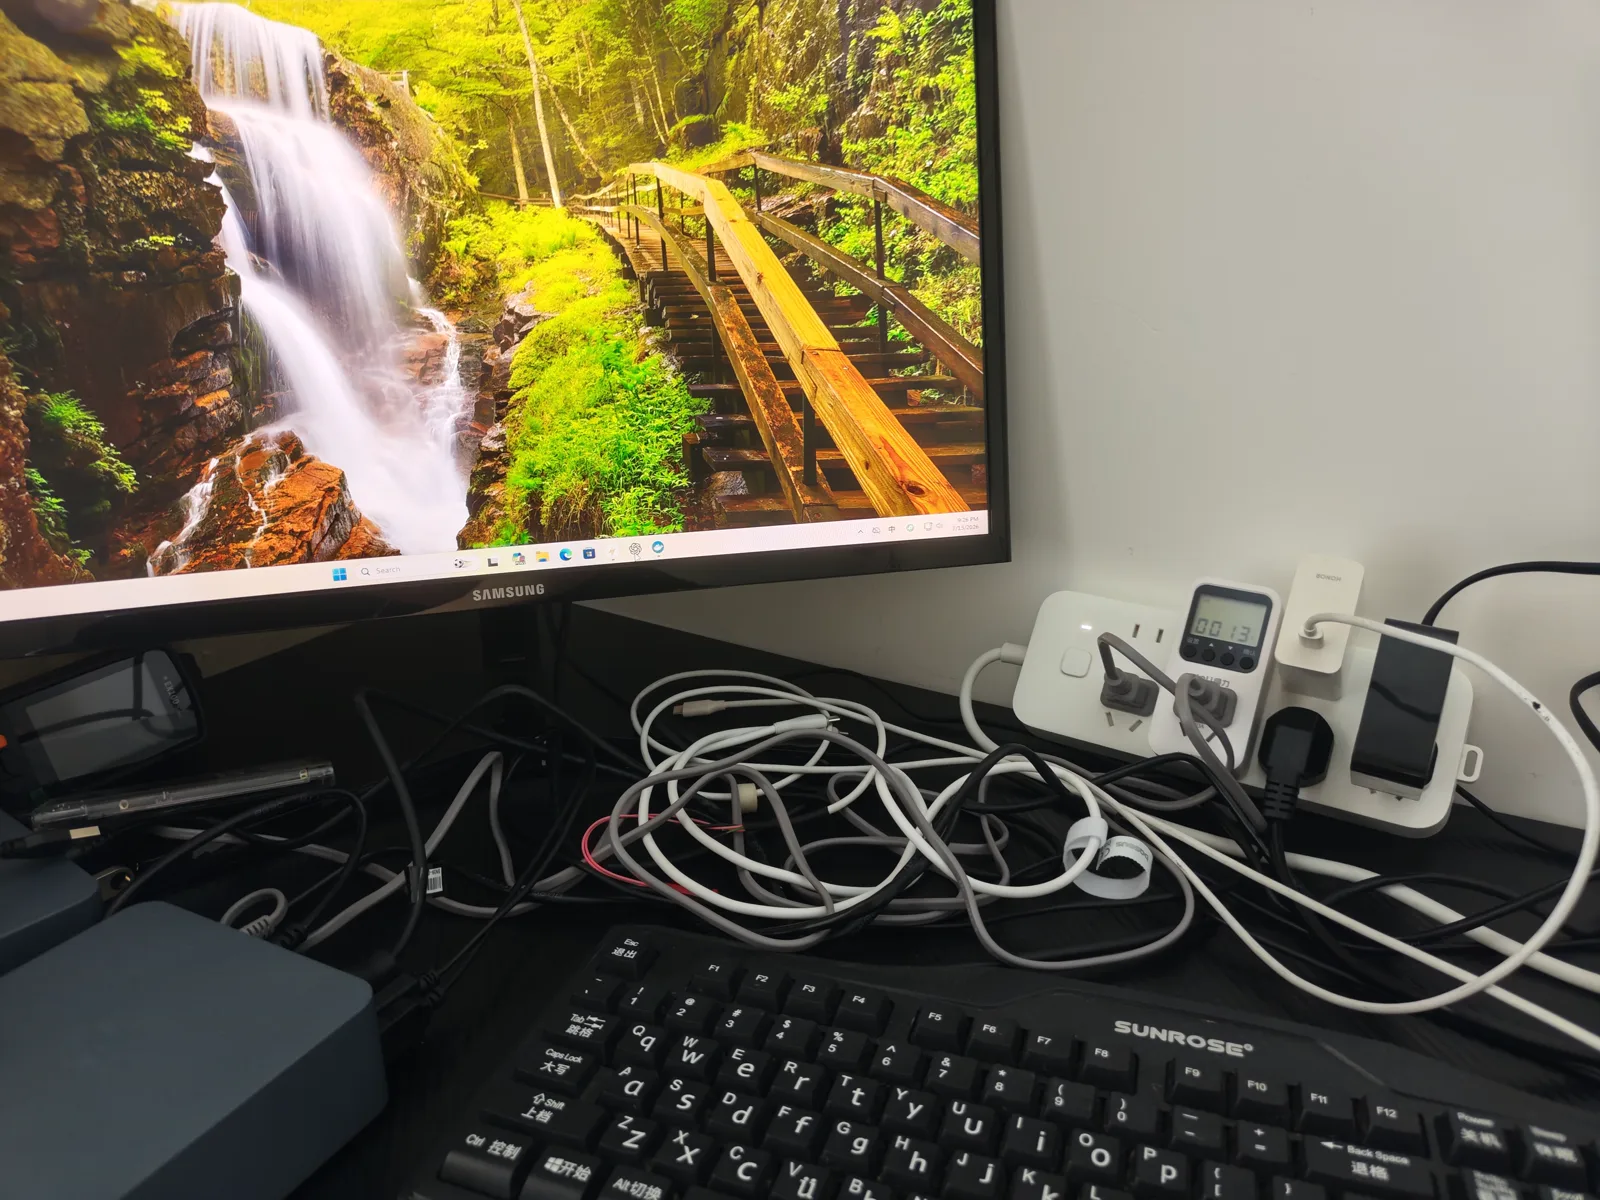
All seven readings
| State | Wall reading | How the state was verified |
|---|---|---|
| Startup | 23W | Power-on sequence observed |
| Windows idle | 14W | Docker fully stopped; readings at 2 and 5 minutes |
| Docker idle | 12W | Jellyfin, PostgreSQL, nginx and Redis healthy |
| CPU full load | 37W | Eight logical processors sampled at 100% |
| Jellyfin QSV | 13W | h264_qsv and vpp_qsv confirmed in log |
| S3 sleep | 1W | Suspend event succeeded |
| Normal shutdown | 1W | Windows shutdown completed and power stabilized |
Windows idle measured 14W twice, while Docker idle showed 12W. That does not prove Docker reduces power consumption. The meter resolution and short background activity are large enough to explain the difference.
Quick answer
For this tested configuration, the useful planning range is approximately 12–14W during light idle, 13W during the observed QSV transcode, and 37W during sustained CPU load. Startup reached about 23W. Sleep and shutdown both displayed about 1W on the whole-watt meter.
Those figures describe one complete EQi12 system at the wall, including conversion loss, memory, NVMe storage, networking and the active operating system. They are more useful for electricity planning than CPU package power, but they are not long-duration averages.
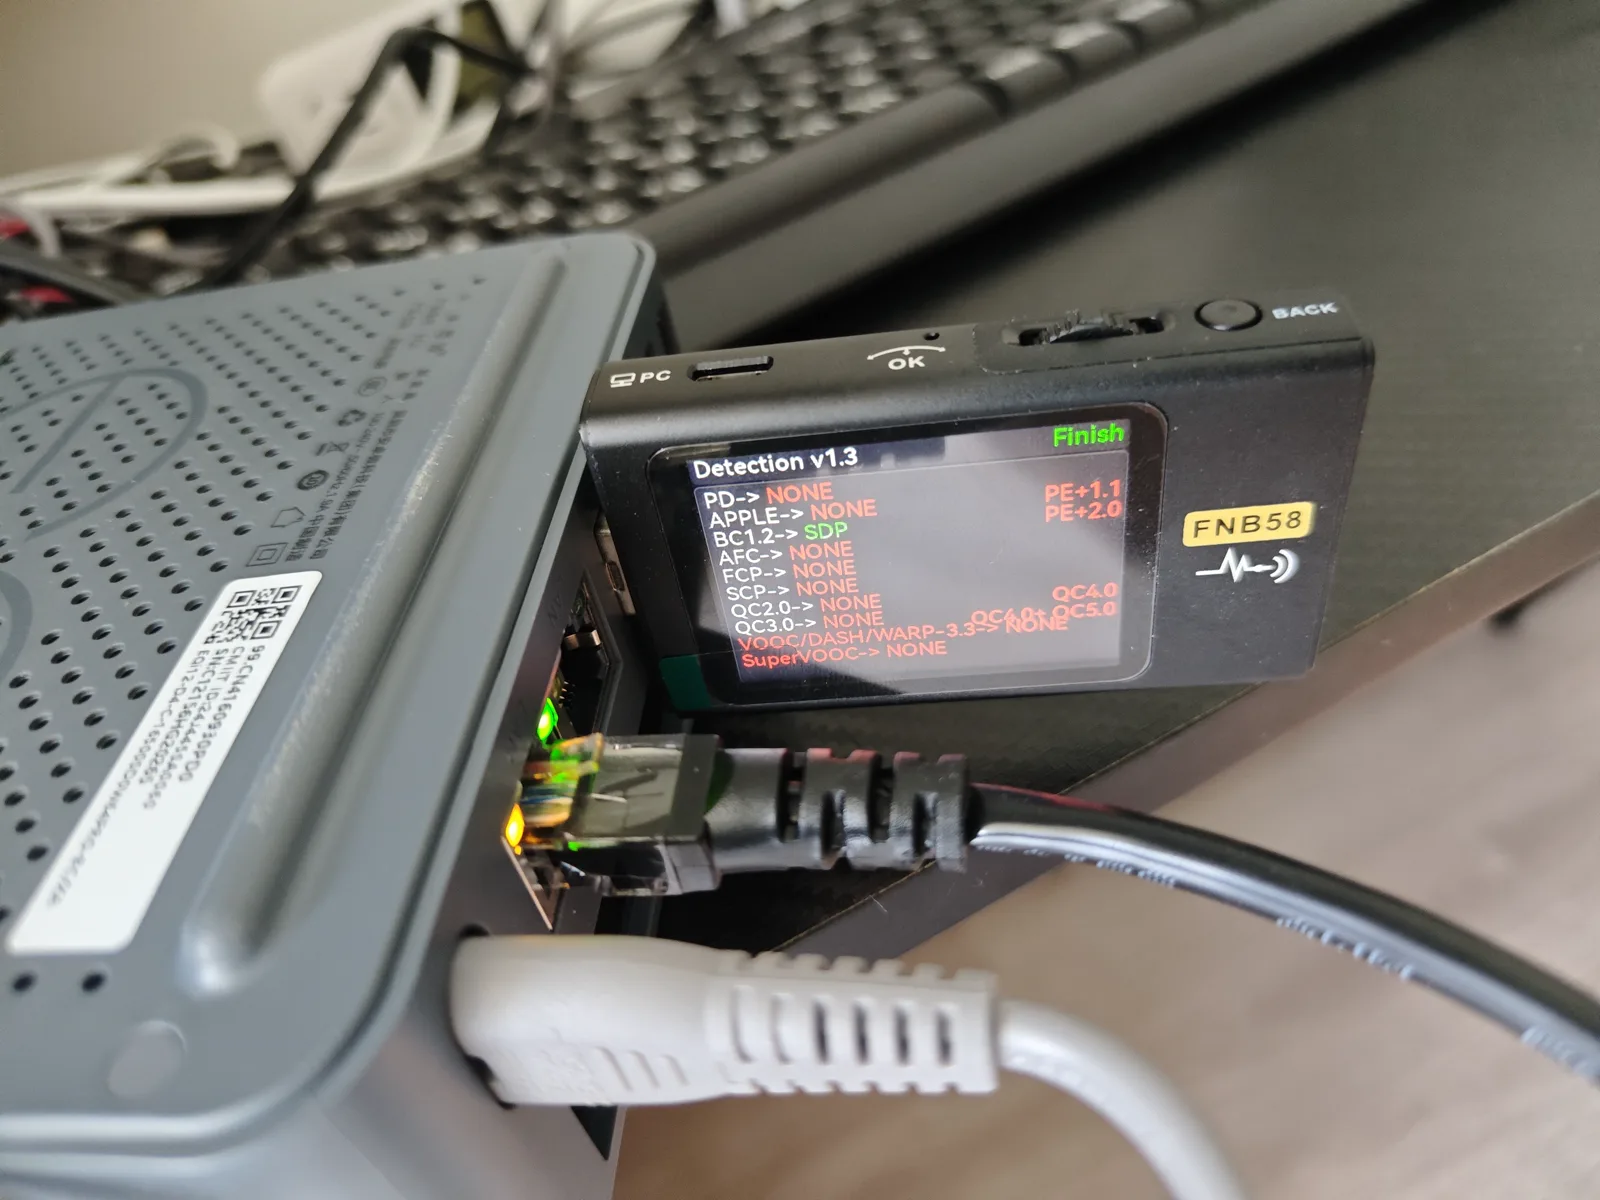
What matters for a 24/7 server
Idle behavior dominates annual energy use. A system that spends most of the year near 12–14W will use far less electricity than a desktop idling at several times that level, even if both reach similar short peaks.
At a constant 14W, annual energy is approximately 122.6kWh. At 12W it is approximately 105.1kWh. Actual cost depends on your electricity price, uptime and time spent under load. Use the home-server power cost calculator with your own rate instead of copying a regional cost estimate. For the full calculation method with worked examples across different server types and electricity rates, see the home server power cost guide.
| Constant average | Daily energy | Annual energy |
|---|---|---|
| 12W | 0.288kWh | 105.1kWh |
| 14W | 0.336kWh | 122.6kWh |
| 20W | 0.480kWh | 175.2kWh |
The 20W row is a planning comparison, not an EQi12 measurement. It shows why attached hard drives, USB devices, and heavier background services must be included when estimating a finished server.
CPU load versus Quick Sync
The 37W CPU-load reading was the highest recorded state. Jellyfin QSV showed about 13W during the verified 4K60-to-1080p60 hardware-transcode activity.
That contrast demonstrates the purpose of a fixed-function media engine, but it is not a controlled energy-per-job comparison. Jellyfin can process ahead, and the meter reading was not a five-minute average. The useful conclusion is that the verified QSV path did not require CPU-load-level wall power during the observation.
Sleep and shutdown
Both S3 sleep and normal shutdown displayed about 1W. The identical whole-watt reading does not prove exact equality below the meter resolution.
Sleep Wake-on-LAN succeeded four times out of five, while shutdown Wake-on-LAN succeeded five out of five. With no measured whole-watt sleep advantage and less consistent waking, shutdown is the more defensible unattended default for this particular configuration.
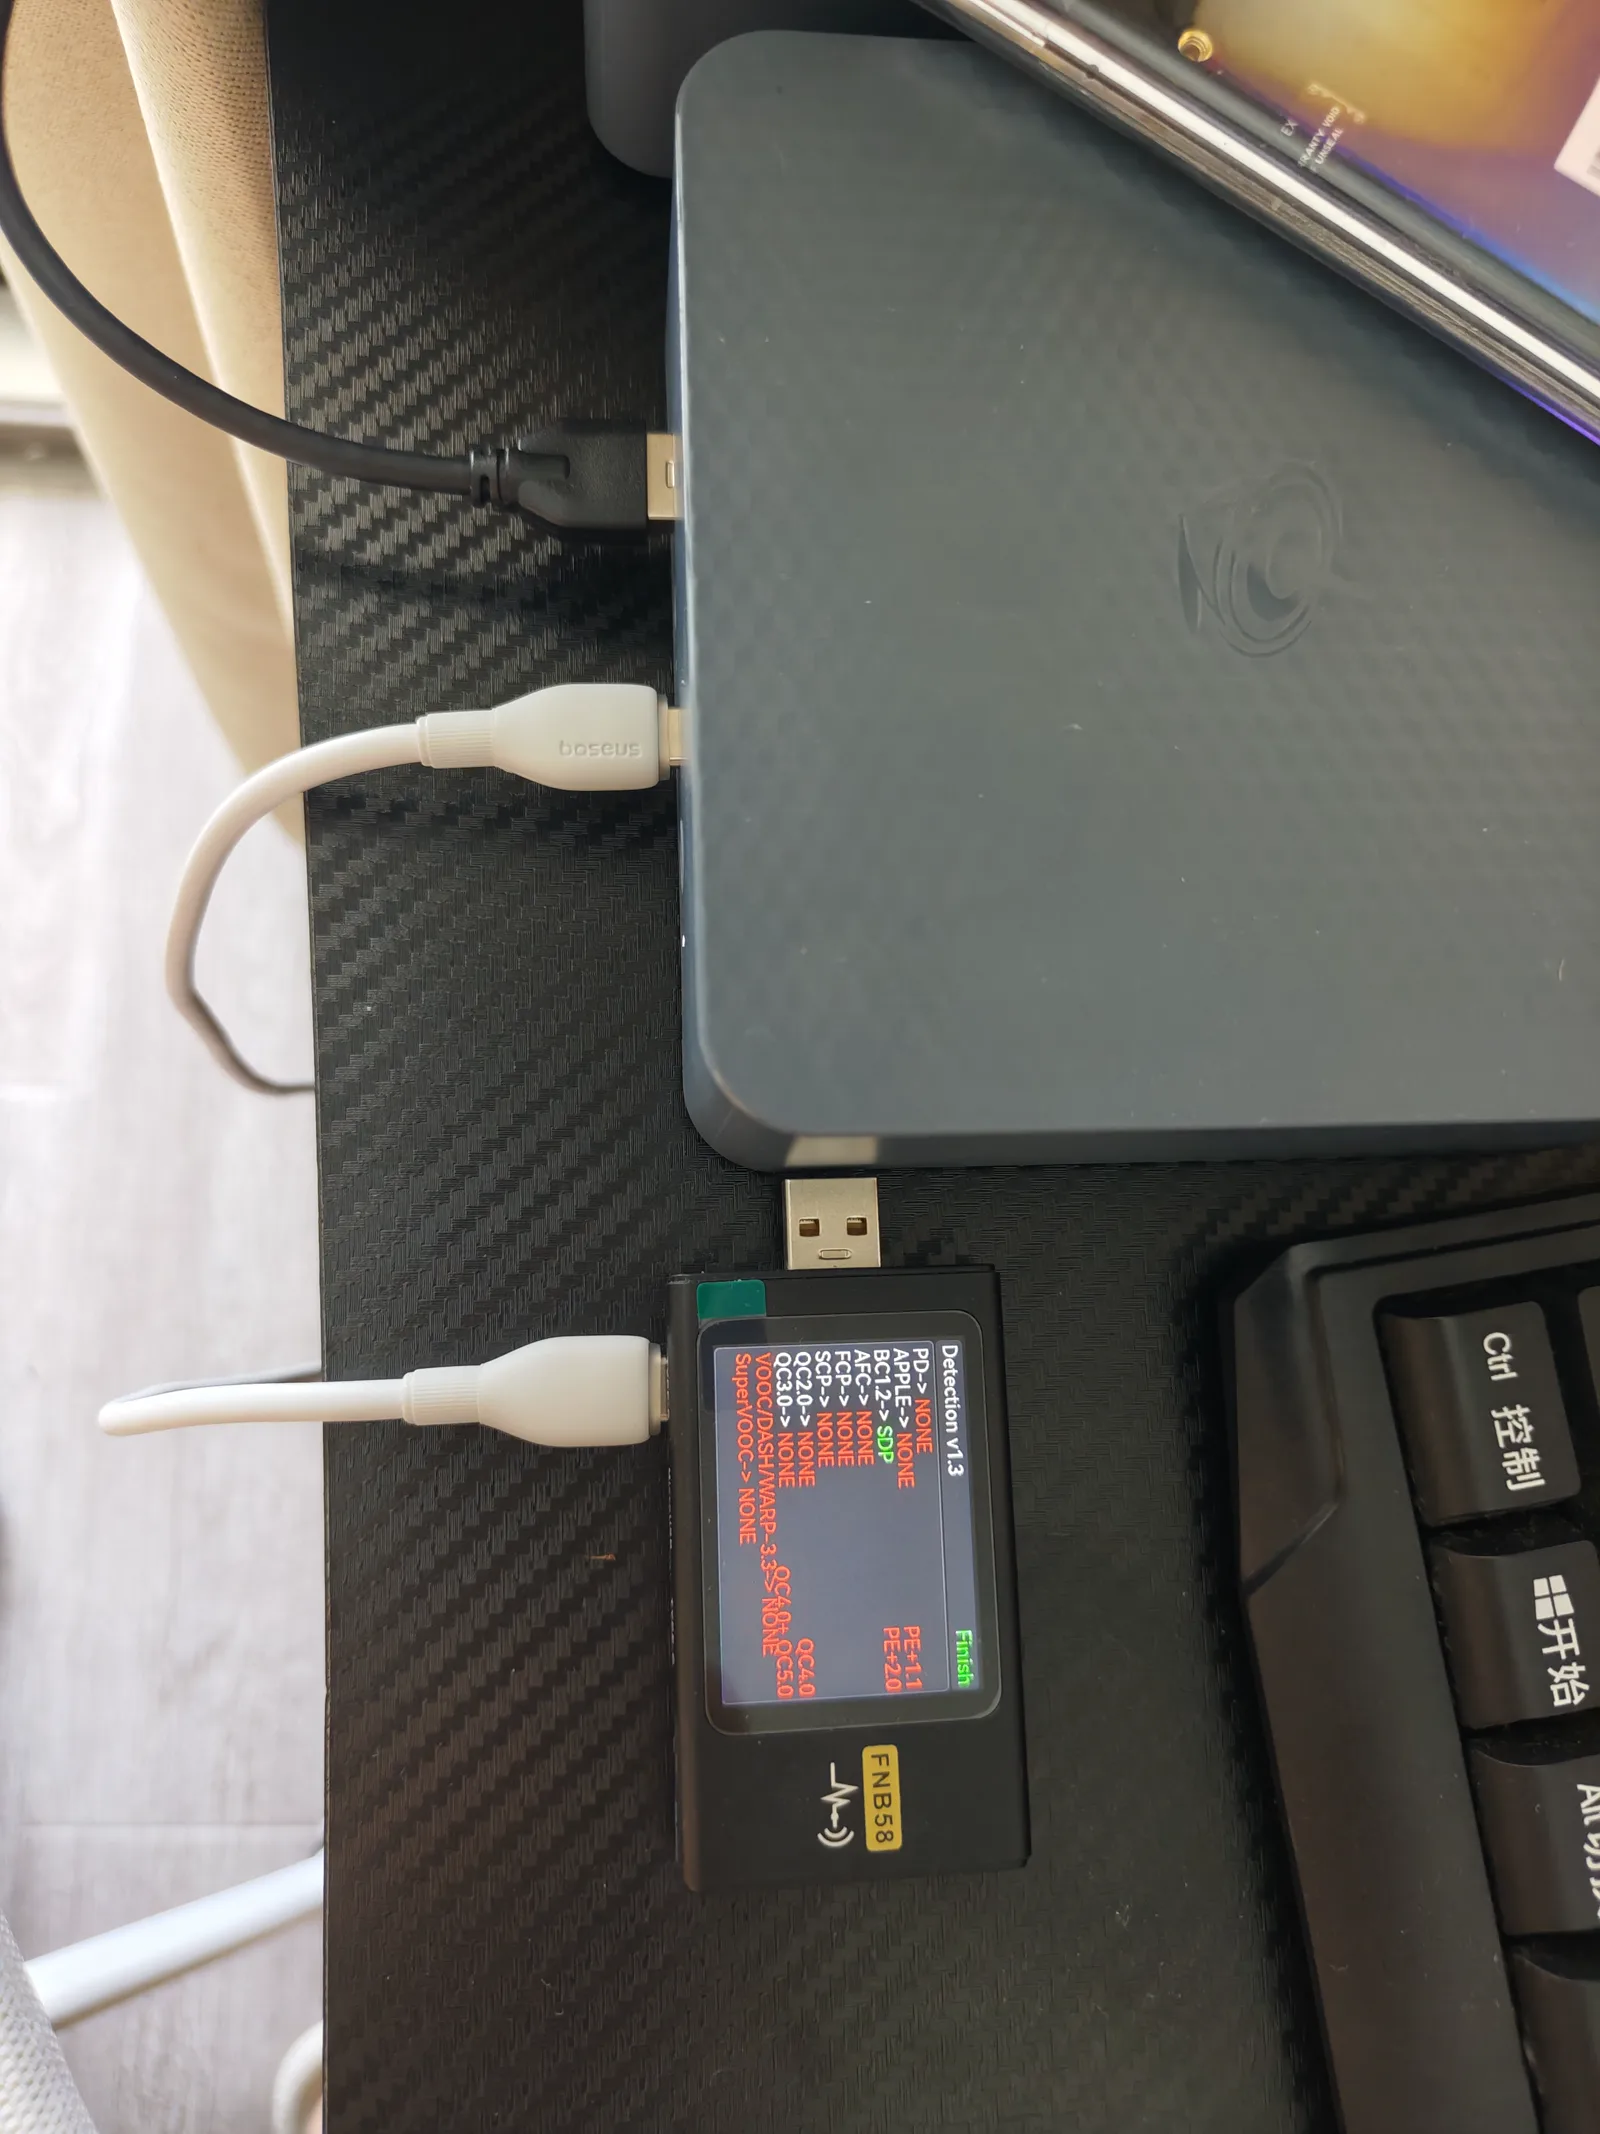
Limits
The test did not use a high-resolution logging power analyzer, isolate the display’s influence, or repeat every state over several hours. It should not be used to claim universal unit-to-unit power behavior.
The supported result is a practical home-server power envelope for the tested unit: low-teens idle, high-30s CPU load, low-teens verified QSV activity and approximately 1W on the meter in sleep or shutdown.
How to reproduce the measurement
Use a wall meter that displays at least tenths of a watt if you need to distinguish sleep from shutdown. Record the Windows build, power plan, attached USB devices, monitor state, network links, and room conditions. Let each idle state settle, take several readings over a fixed interval, and report a range or average instead of the lowest number seen.
For load states, preserve the command or application log that proves what was running. A high reading without a bound workload is not comparable; a low reading taken after a task finished is equally misleading.
Related evidence and sources
The complete EQi12 review connects these readings to Docker, storage, network and recovery behavior. The Jellyfin QSV test documents the hardware-transcode path behind the 13W observation. For how these readings fit alongside storage, stability and network results, see what 135 measurements on a $200 mini PC actually show. All numeric values on this page come from the retained physical-meter record rather than a manufacturer power specification.