
The short answer
Deciding whether your network itself needs an upgrade before you rearrange storage? The 2.5GbE vs gigabit decision page covers the link side of the same bottleneck chain.
Most home servers have three places to put data: the internal NVMe, an external USB SSD, and a network share on another machine. They are not interchangeable, and the differences are not subtle. On our Beelink EQi12 test unit the fastest path is roughly sixteen times faster than the slowest, and the slowest path looks exactly like the fast ones from the outside.
Here is the placement we recommend, before any of the evidence:
| Workload | Put it here | Why | Watch out for |
|---|---|---|---|
| Docker volumes with a database (PostgreSQL, MariaDB, InfluxDB) | Internal NVMe | Lowest latency, no external link to renegotiate after sleep or reboot | The boot disk is small. Our unit has 512 GB shared with Windows |
| Docker volumes holding config and static assets | Internal NVMe, or a verified fast USB SSD | Mostly sequential reads at container start | Never assign a port you have not measured |
| Media library for Jellyfin or Plex | Fast USB SSD | Sequential reads dominate; easy to expand without opening the case | One port on our unit ran at USB 2.0-class speed |
| Backup target | External USB SSD, or a network share on a second machine | Either keeps the copy off the boot disk | A slow port turns a nightly job into a multi-hour job |
| Download and transcode scratch space | Internal NVMe | Fastest, and scratch data is disposable | Do not let it fill the boot volume |
| Cold archive you rarely read | Network share on another machine | Survives a failure of the main disk | 1 GbE caps you near 112 MiB/s |
The rest of this page explains what each number is, what it does not measure, and how to reproduce it on your own hardware.
What we actually measured
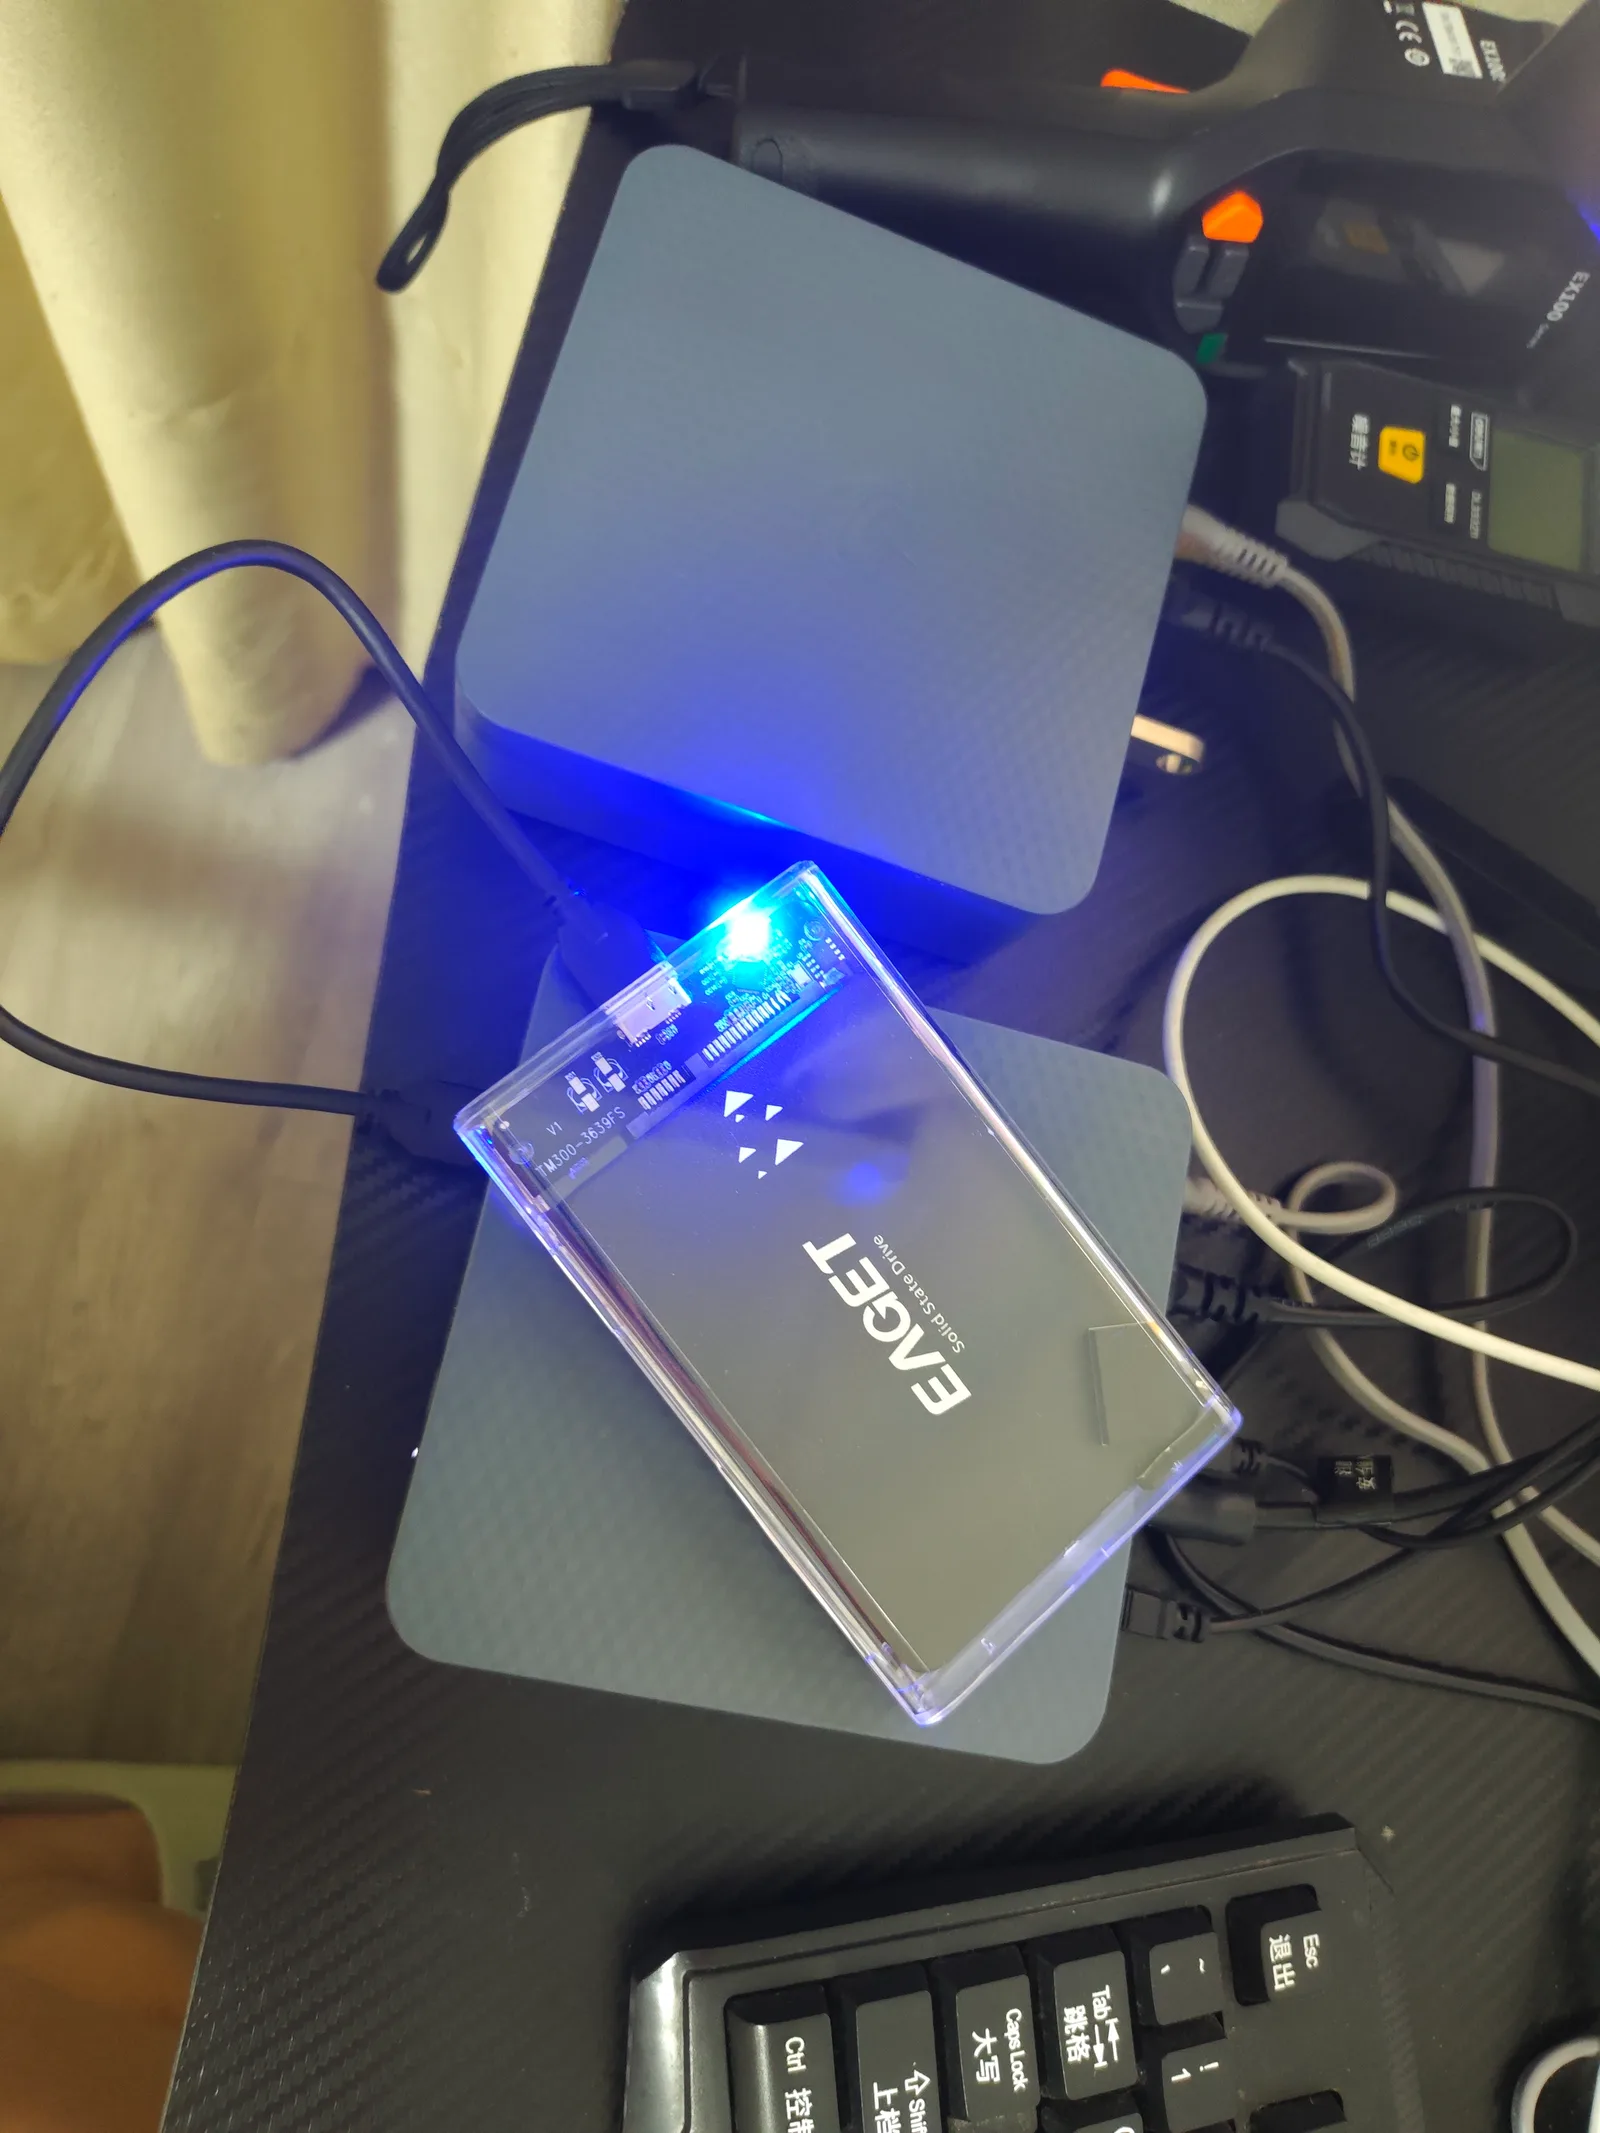
Every throughput figure below comes from the same EAGET 1 TB external SSD and the same cable, moved across four physical USB-A paths on one machine, plus the internal WD PC SN540 512 GB NVMe and a wired gigabit transfer to a second computer. Large transfers were 50 GiB (53,687,091,200 bytes); the slow-port retests used 4 GiB per round.
| Path | Write | Read | Integrity |
|---|---|---|---|
| Internal NVMe, sustained 50 GiB | ~623.29 MiB/s | ~468.2 MiB/s | SHA-256 matched |
| Three faster USB-A paths (50 GiB each) | 300.64 — 301.91 MiB/s | 431.80 — 432.06 MiB/s | SHA-256 matched |
| One slow rear USB-A path, 3 retests (4 GiB) | 39.35 — 39.75 MiB/s | 40.95 — 43.12 MiB/s | matched 3/3 |
| Wired gigabit to a second PC, 4 GiB | 108.76 MiB/s (~912 Mbit/s) | 112.2 MiB/s (~941 Mbit/s) | complete, no missing bytes |
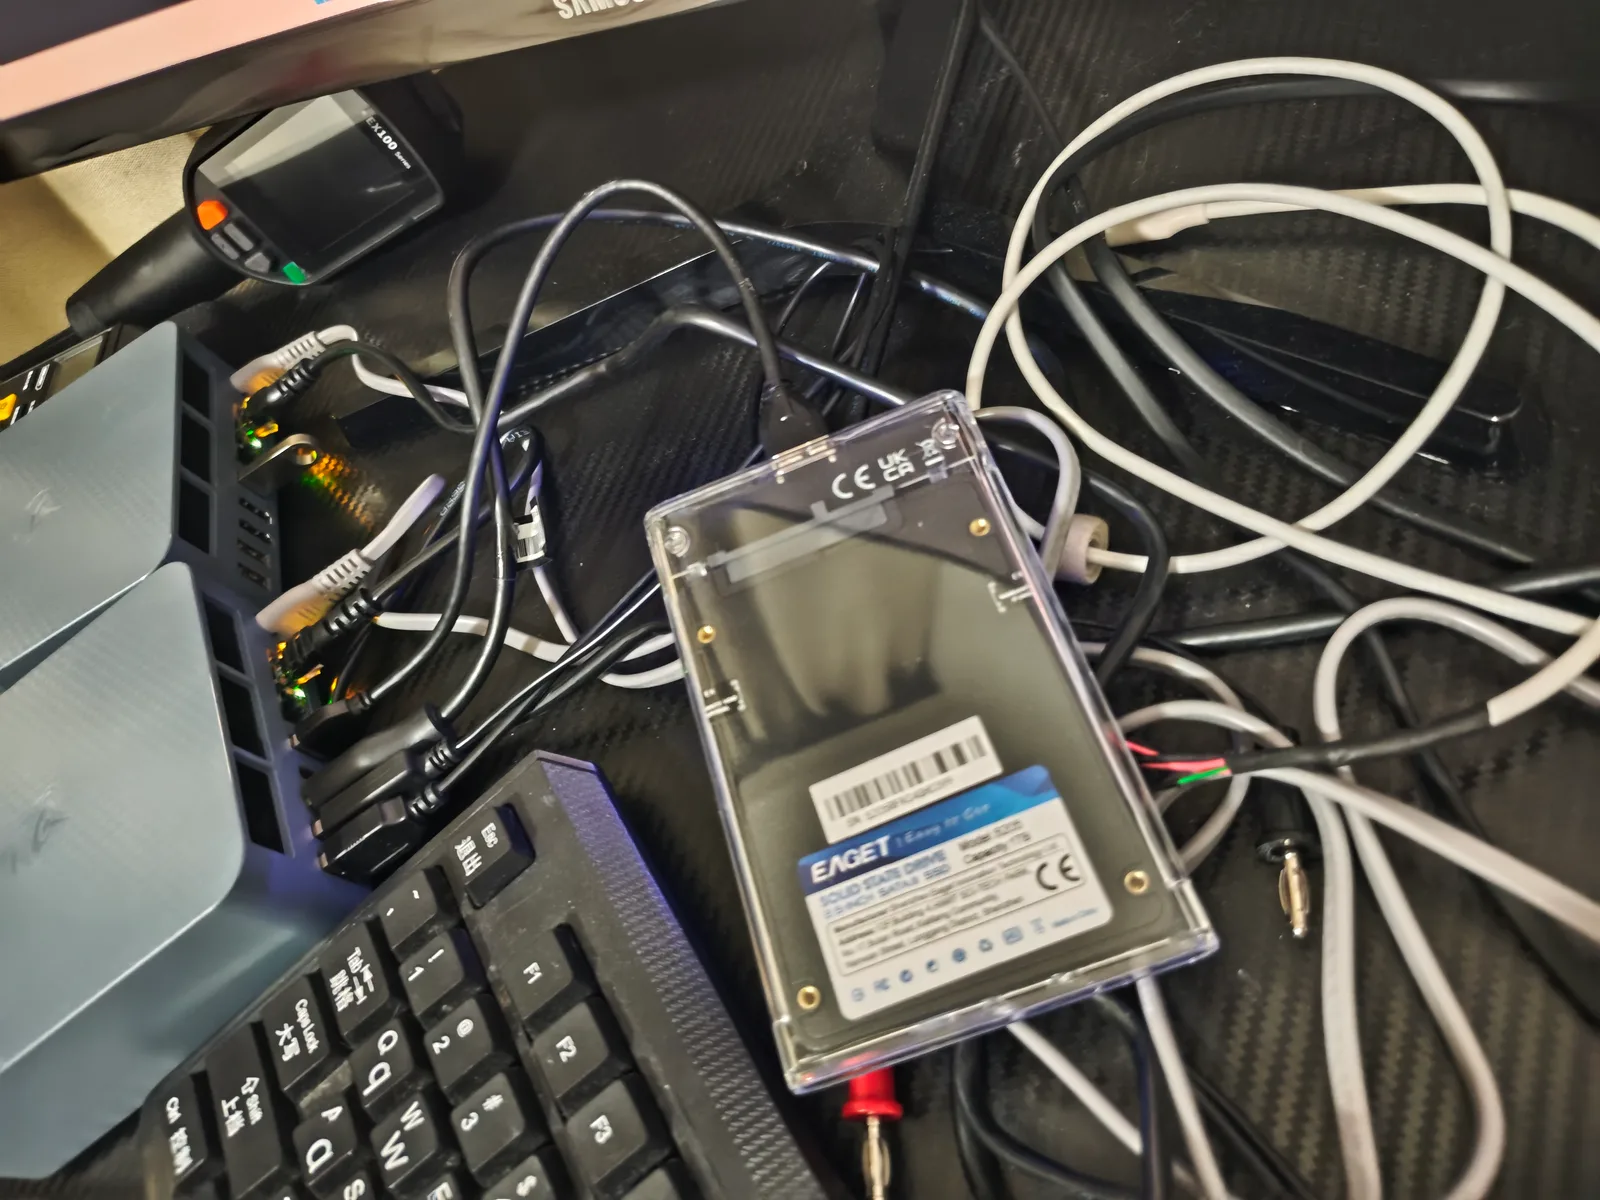
The full port-by-port breakdown, SMART data and the slow-port diagnosis are on the SSD and USB port performance page. The network figures come from the wired Ethernet and Wi-Fi 6 comparison. If your own SMART log shows a Critical Warning (0x02) line during a comparison like this, the NVMe critical warning explainer tells you what it does and does not mean.
Two things matter more than the peak numbers. First, three of four ports were fine — so a single bad measurement on one port is not a reason to distrust external storage. Second, the bad port was invisible. It is the same physical connector, in the same row, and copies complete successfully at a fraction of the speed. That is why port-by-port verification belongs in any storage plan.
Sequential throughput is not the whole story
Everything in the table above is a large, sequential, single-stream transfer. That models a media file or a backup archive well. It does not model a database.
A PostgreSQL volume does thousands of small random writes per second. Its performance is governed by IOPS and latency, not by how fast a 50 GiB file copies. Our sustained tests deliberately do not report random IOPS, because we did not run a controlled random-workload benchmark on this unit — and an invented IOPS number would be worse than no number.
So read the placement table as a statement about bandwidth, and apply these two corrections yourself:
- Databases care about latency, so keep them closest to the CPU. Internal NVMe wins by construction here, regardless of what a sequential USB test shows.
- Media and backups care about bandwidth, so external storage is a fair trade. At ~432 MiB/s read, a fast USB path can feed several simultaneous 4K streams; the bottleneck moves to transcoding, not storage.
If you want the concurrency side of that equation, the two- versus four-stream QSV test shows where the media server actually runs out of headroom.
Worked example: 500 GB of media and 60 GB of Docker volumes
Assume a 500 GB media library and 60 GB of Docker volumes, and ask what a full copy costs on each path. These are arithmetic conversions of the measured rates above (1 MiB = 1,048,576 bytes; 500 GB = 500 × 10¹² bytes), with no filesystem or protocol overhead added:
| Job | Internal NVMe | Fast USB SSD | Slow USB path | Gigabit network |
|---|---|---|---|---|
| Write 500 GB (full backup) | 12.8 min | 26.4 min | 3.4 h | 1.22 h |
| Read 500 GB (restore) | 17.0 min | 18.4 min | 3.2 h | 1.18 h |
| Write 60 GB (volume snapshot) | 1.5 min | 3.2 min | 24.2 min | 8.8 min |
The middle two columns are the interesting pair. A fast USB path is entirely adequate for a nightly 500 GB job. The same job on a degraded port takes longer than most overnight windows, and it will still report success — a backup that finishes at 09:40 is not a backup that finished overnight.
This is exactly the question the Backup Retention and Window Planner answers for your own numbers, and the Network Transfer Time tool does the same for a single transfer with protocol overhead included.
Decision tree: pick a home for each workload
Where should this data live?
├── Is it read or written in many small random operations?
│   ├── Yes (database, index, VM disk image)
│   │   └── Internal NVMe — then back it up somewhere else
│   └── No (large sequential files)
│       ├── Is it the only copy?
│       │   ├── Yes → This is a backup problem, not a placement problem.
│       │   │         Read the 3-2-1 rule below.
│       │   └── No → Continue
│       ├── Does it need to survive failure of the main machine?
│       │   ├── Yes → Network share on a second machine (accept ~112 MiB/s)
│       │   └── No → External USB SSD on a port you have measured
│       └── Is it disposable (scratch, downloads, transcode temp)?
│           └── Internal NVMe, with a job that cleans up after itself
The branching that surprises people is the middle one: if a dataset has only one copy, its storage tier is irrelevant. Speed decisions come after the copy decision.
How to measure your own paths in ten minutes
Do not trust a port because of its colour, its position, or the label printed next to it. Measure it.
On Windows, time a large copy and verify the result:
$src = 'C:\bench\source.bin'
$dst = 'E:\bench\source.bin'

$sw = [System.Diagnostics.Stopwatch]::StartNew()
Copy-Item -Path $src -Destination $dst -Force
$sw.Stop()

$sizeMiB = (Get-Item $dst).Length / 1MB
'Write: {0:N2} MiB/s in {1:N1} s' -f ($sizeMiB / $sw.Elapsed.TotalSeconds), $sw.Elapsed.TotalSeconds

(Get-FileHash $src -Algorithm SHA256).Hash -eq (Get-FileHash $dst -Algorithm SHA256).Hash
On Linux, use direct I/O so the page cache does not flatter the result:
# Write test
dd if=/dev/zero of=/mnt/target/testfile bs=1M count=4096 oflag=direct status=progress

# Read test with caches dropped
sudo sh -c 'echo 3 > /proc/sys/vm/drop_caches'
dd if=/mnt/target/testfile of=/dev/null bs=1M iflag=direct status=progress

# Clean up
rm /mnt/target/testfile
For a network path, measure the link before blaming storage:
iperf3 -c 192.168.5.8 -t 30 -P 4Paste the result into the iperf3 Result Analyzer to compare both directions and see link efficiency. If the network measures far below ~940 Mbit/s on a gigabit path, fix that before upgrading any disk.
Use at least a few GB, not a few hundred MB. Small transfers stay in cache or in the SSD’s SLC buffer and report speeds you will never see on a real backup.
Three failure modes we hit
A port that looks fine and is not. One rear USB-A path on our unit repeated 39.35 — 39.75 MiB/s across three 4 GiB rounds while its neighbours did ten times better. Hashes still matched, so nothing failed loudly. The full isolation procedure is in USB SSD limited to about 40 MB/s.
A boot disk quietly becoming the data disk. The internal NVMe is the fastest place to put things, which makes it the natural dumping ground. On a 512 GB unit, Windows plus a container stack plus a media cache reaches full faster than expected, and a full boot volume takes the whole server down.
Expecting the network to behave like a local bus. At ~112 MiB/s, a gigabit link is roughly a third of a fast USB SSD. That is fine for nightly backups and terrible for running a database over SMB.
Where backups fit
Placement and backup are separate decisions, and only one of them is optional. The 3-2-1 pattern — three copies, two different media, one copy off-site or at least on a different machine — is what turns a storage layout into a recovery plan.
On a single mini PC, the practical version is: working data on the internal NVMe, a versioned backup on an external USB SSD on a measured fast port, and a periodic copy to a second machine over the network. The network leg is the slow one, so schedule it weekly rather than nightly.
Use the Backup Retention and Window Planner to check whether your nightly job actually fits inside your window before you trust it, and the ZFS and RAID planning guide if you are building a pool rather than a single disk. To size a media library before you buy drives, start with the Media Storage Calculator.
Frequently asked questions
Can I run Docker entirely from a USB SSD?
You can, and on a measured fast port it works — but keep the database volumes on the internal NVMe. Random write latency is what a database feels, and our sequential measurements do not capture it. The [Docker Compose starter generator](/tools/docker-compose-generator/) produces a stack with named volumes you can move between paths.
Why is my external SSD slower than the spec sheet?
Usually a link-negotiation or port-identity problem, not a bad drive. Our own unit produced a 39 MiB/s result on one port and 301 MiB/s on the port next to it, with the same drive and cable. Work through the [40 MB/s isolation procedure](/fix/usb-ssd-limited-40mbs/) before replacing hardware.
Should I upgrade to 2.5 GbE for backups?
Only after you have measured a real bottleneck. A 500 GB nightly job takes about 1.22 hours on the 108.76 MiB/s we measured, which fits most overnight windows. If your job does not fit, the [window planner](/tools/backup-retention-planner/) will tell you whether more bandwidth or a longer window is the cheaper fix.
Does the internal NVMe use more power?
In our measurements the whole machine drew about 12 W with four Docker containers idle and about 37 W with all cores loaded. Storage placement did not change the wall-power picture on this unit, and we do not have controlled per-drive power data, so we do not publish one.
Sources and how to reproduce
Every number on this page is either measured on our unit or derived arithmetically from a measured rate, and the arithmetic is shown.
- Storage throughput, SMART and the slow-port retests: SSD and USB port performance
- Gigabit and Wi-Fi results: wired Ethernet vs Wi-Fi 6
- Why the media server runs out of headroom before storage does: two vs four QSV workloads
- Raw logs, CSVs and hashes: the eqi12-measurement-data repository, released under CC BY 4.0, including
storage/EQi12_USB_四接口50GiB最终对照.txt,storage/EQi12_InternalSSD_50GiB_Result.txt,storage/EQi12_USB_四接口50GiB最终对照.txtandnetwork/EQi12_双千兆有线4GiB双向测试最终结果.txt - Test conditions and exclusions: the methodology page
What we did not measure, and therefore do not claim: random IOPS, drive-level power draw, RAID or ZFS pool throughput, and behaviour with a spinning USB hard drive. Where those matter to your build, measure them on your own hardware using the commands above.