
Why power cost matters more than you think
A home server runs 24 hours a day, 365 days a year. That is 8,760 hours of electricity consumption. Even a small difference in wattage compounds into a meaningful annual cost.
Most people estimate server power from CPU TDP or a manufacturer specification. Those numbers describe the processor in isolation, not the complete system at the wall. Memory, storage, networking, power supply conversion loss, and attached USB devices all add to the real number.
This guide uses actual wall-meter measurements from a Beelink EQi12 mini PC running Windows 11 with Docker, Jellyfin, PostgreSQL and Redis. The same method works for any server — NAS, desktop, or mini PC.
The formula behind every power cost estimate
Before looking at specific numbers, understand the calculation. It is simple enough to do on a calculator but precise enough to plan a budget.
Step 1: measure your actual power draw
Use a wall power meter. Place it between the AC outlet and your server power supply. Record readings in these states:
| State | What to measure |
|---|---|
| Idle | Operating system loaded, no active workloads |
| Typical load | Your usual services running (Docker, file sharing, media) |
| Peak load | Backups, transcoding, or heavy computation |
| Sleep/standby | If the server sleeps overnight |
Why wall power, not CPU package power: CPU tools report the processor only. They miss memory, SSD, network controllers, USB devices, and the 5-15% conversion loss in the power supply. Wall power is the number that appears on your electricity bill.
Step 2: calculate weighted average power
Most servers do not run at peak load all day. A realistic estimate weights idle and load hours:
Average watts = (idle watts × idle hours + load watts × load hours) ÷ 24For example, a server that idles at 14W for 22 hours and runs at 37W for 2 hours:
Average watts = (14 × 22 + 37 × 2) ÷ 24 = 15.9WStep 3: convert to annual kWh and cost
Annual kWh = average watts × 24 × 365  1,000
Annual cost = annual kWh × electricity rate per kWh
At 15.9W average and $0.16/kWh (US residential average):
Annual kWh = 15.9 × 24 × 365 ÷ 1,000 = 139.3 kWh
Annual cost = 139.3 × 0.16 = $22.29
Use the Home Server Power Cost Calculator to run this calculation with your own numbers. It supports multiple currencies and lets you adjust idle hours, load hours, and electricity rate.
Real measured data: Beelink EQi12 mini PC
Here are the actual wall-power readings from our EQi12 test unit. The meter displayed whole watts, so treat each value as an approximate observation rather than a laboratory-grade measurement.
📊 The raw logs are open. The full measurement session — power logs, sleep/shutdown events, Jellyfin transcode power and the 24-hour overnight sample — is published in the eqi12-measurement-data repository under CC BY 4.0. Fork it, rerun the scripts, and compare against your own mini PC.
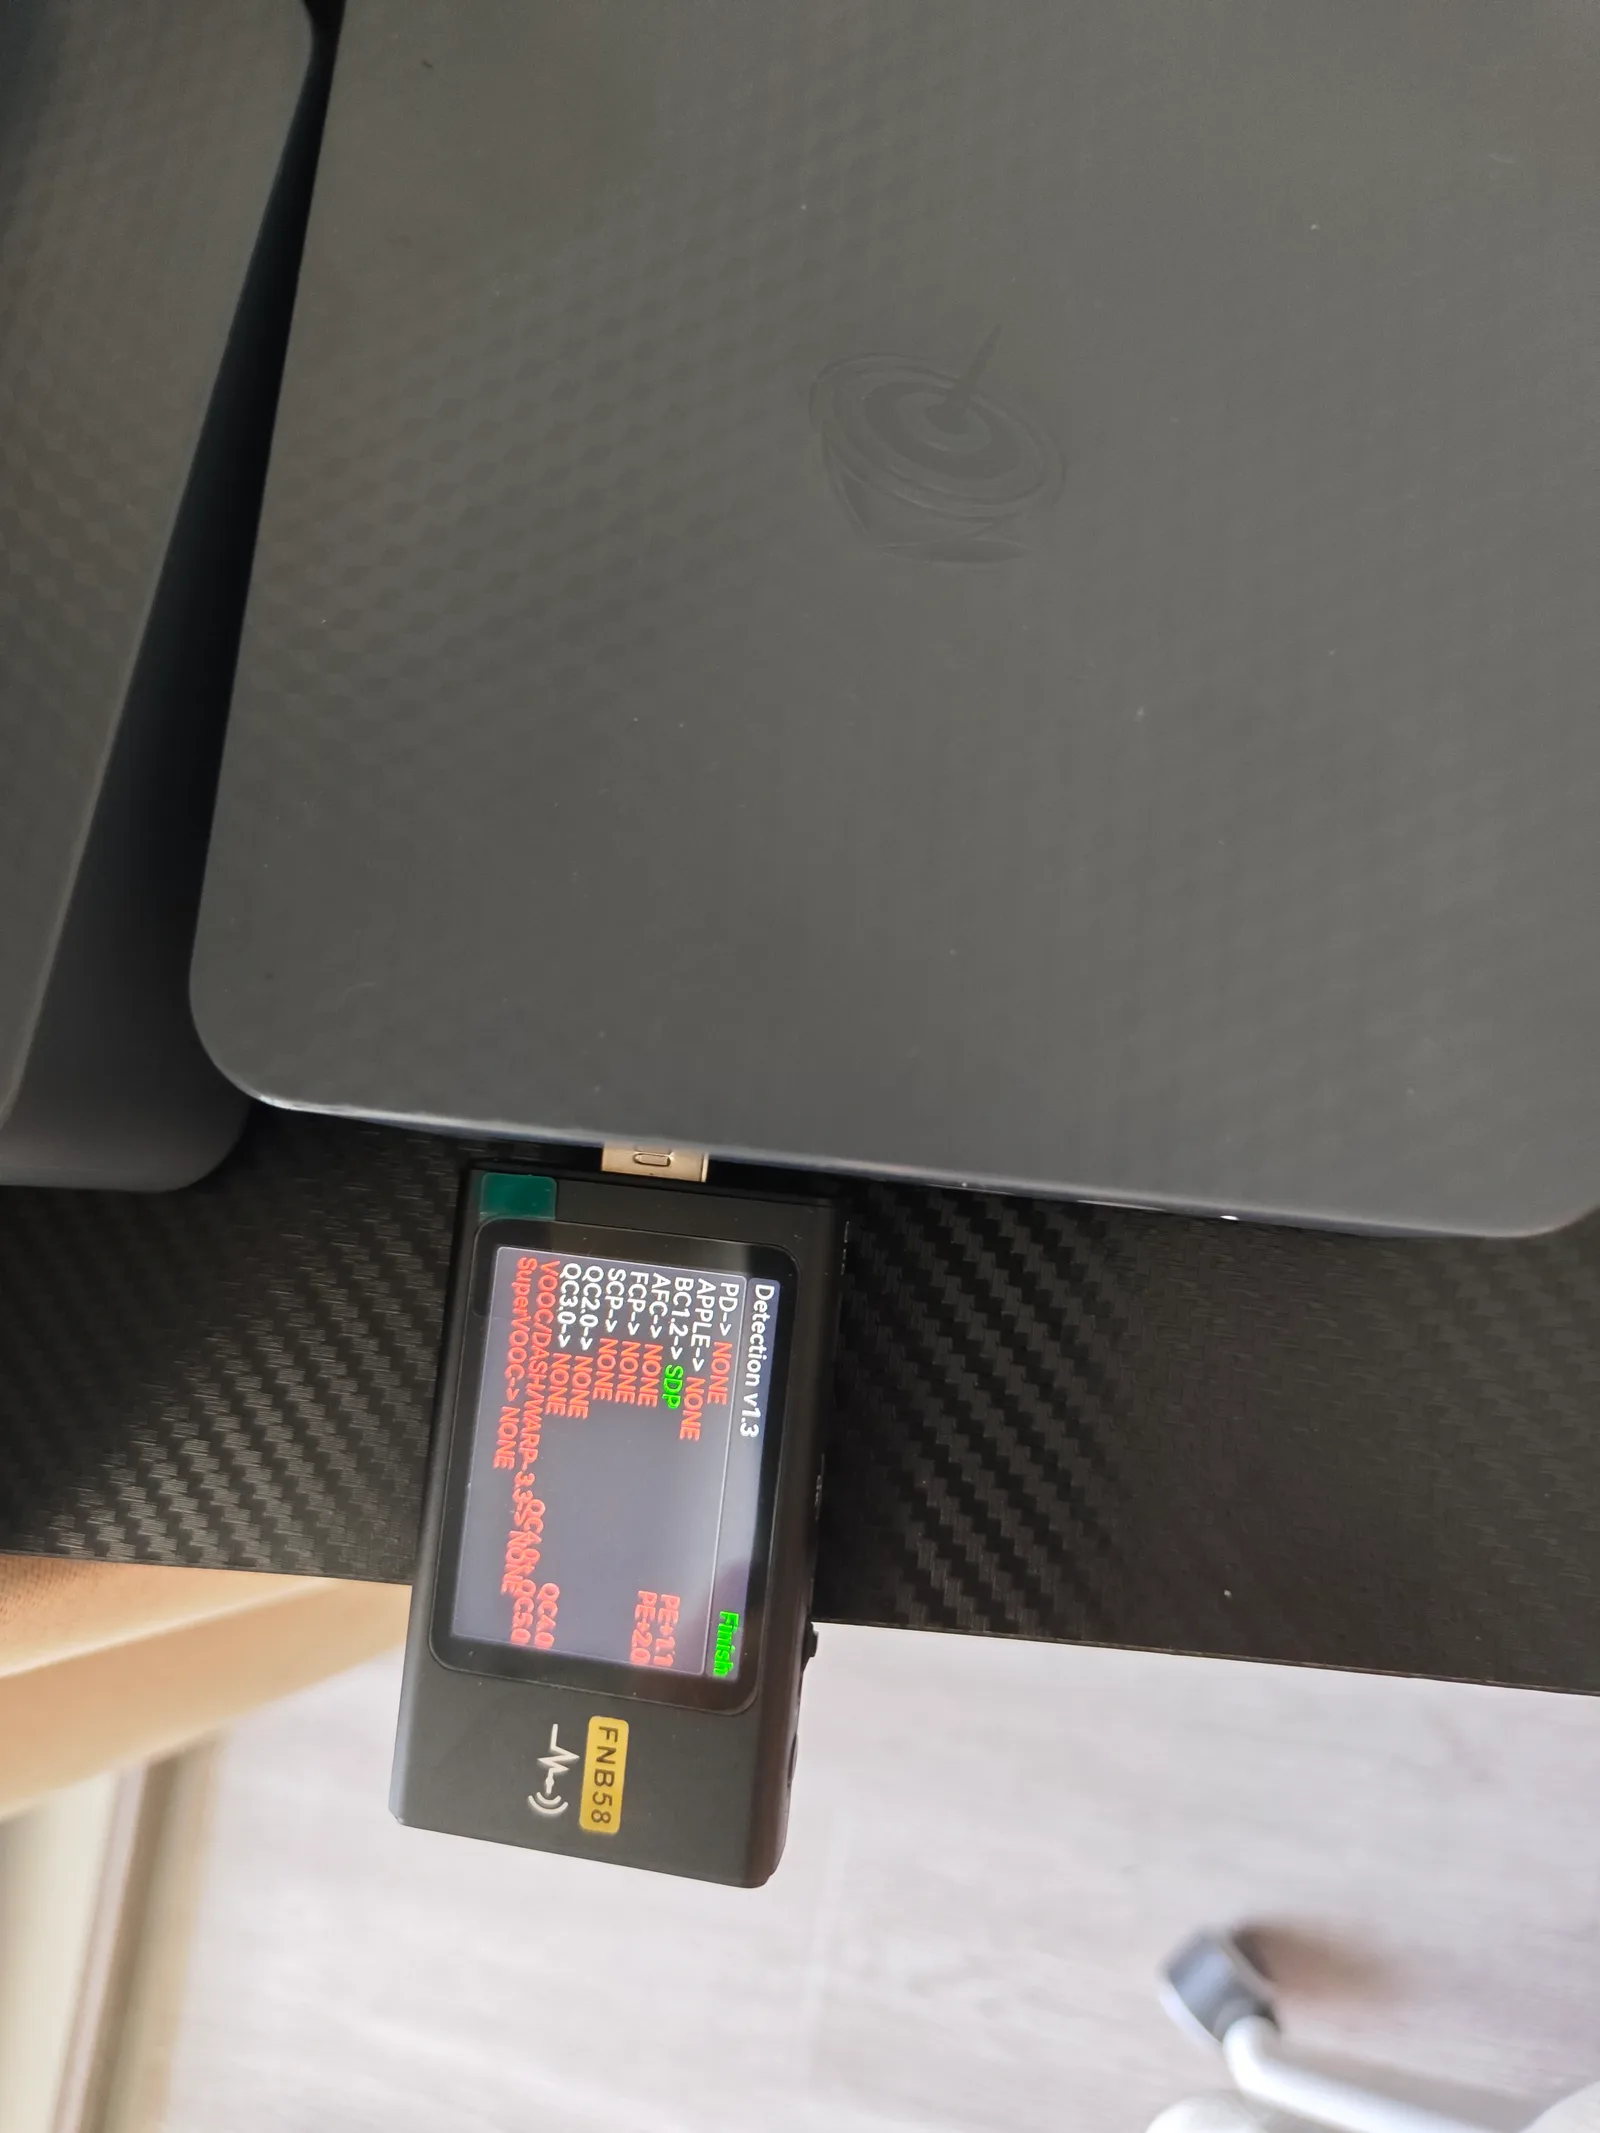
Power meter reading during a typical measurement session. The meter displays whole watts; the same setup was used for every state from idle through sustained load.
| State | Wall power | Notes |
|---|---|---|
| Startup | 23W | Power-on sequence |
| Windows idle | 14W | Docker fully stopped |
| Docker services idle | 12W | Jellyfin, PostgreSQL, nginx, Redis healthy |
| Sustained CPU load | 37W | All logical processors at 100% |
| Jellyfin QSV transcoding | 13W | Two 4K60-to-1080p60 streams |
| S3 sleep | 1W | Whole-watt meter resolution |
| Shutdown | 1W | Whole-watt meter resolution |
The full seven-state power report includes the meter setup, thermal images, and measurement limitations.
What these numbers mean for annual cost
Using the Docker-idle figure (12W) as the baseline and assuming 2 hours of CPU load per day:
Average watts = (12 × 22 + 37 × 2) ÷ 24 = 14.1W
Annual kWh = 14.1 × 24 × 365 ÷ 1,000 = 123.5 kWh| Electricity rate | Annual cost |
|---|---|
| $0.10/kWh (low) | $12.35 |
| $0.16/kWh (US avg) | $19.76 |
| $0.25/kWh (high) | $30.88 |
| $0.35/kWh (EU avg) | $43.23 |
For context, that is less than the monthly cost of a single streaming subscription in most regions.
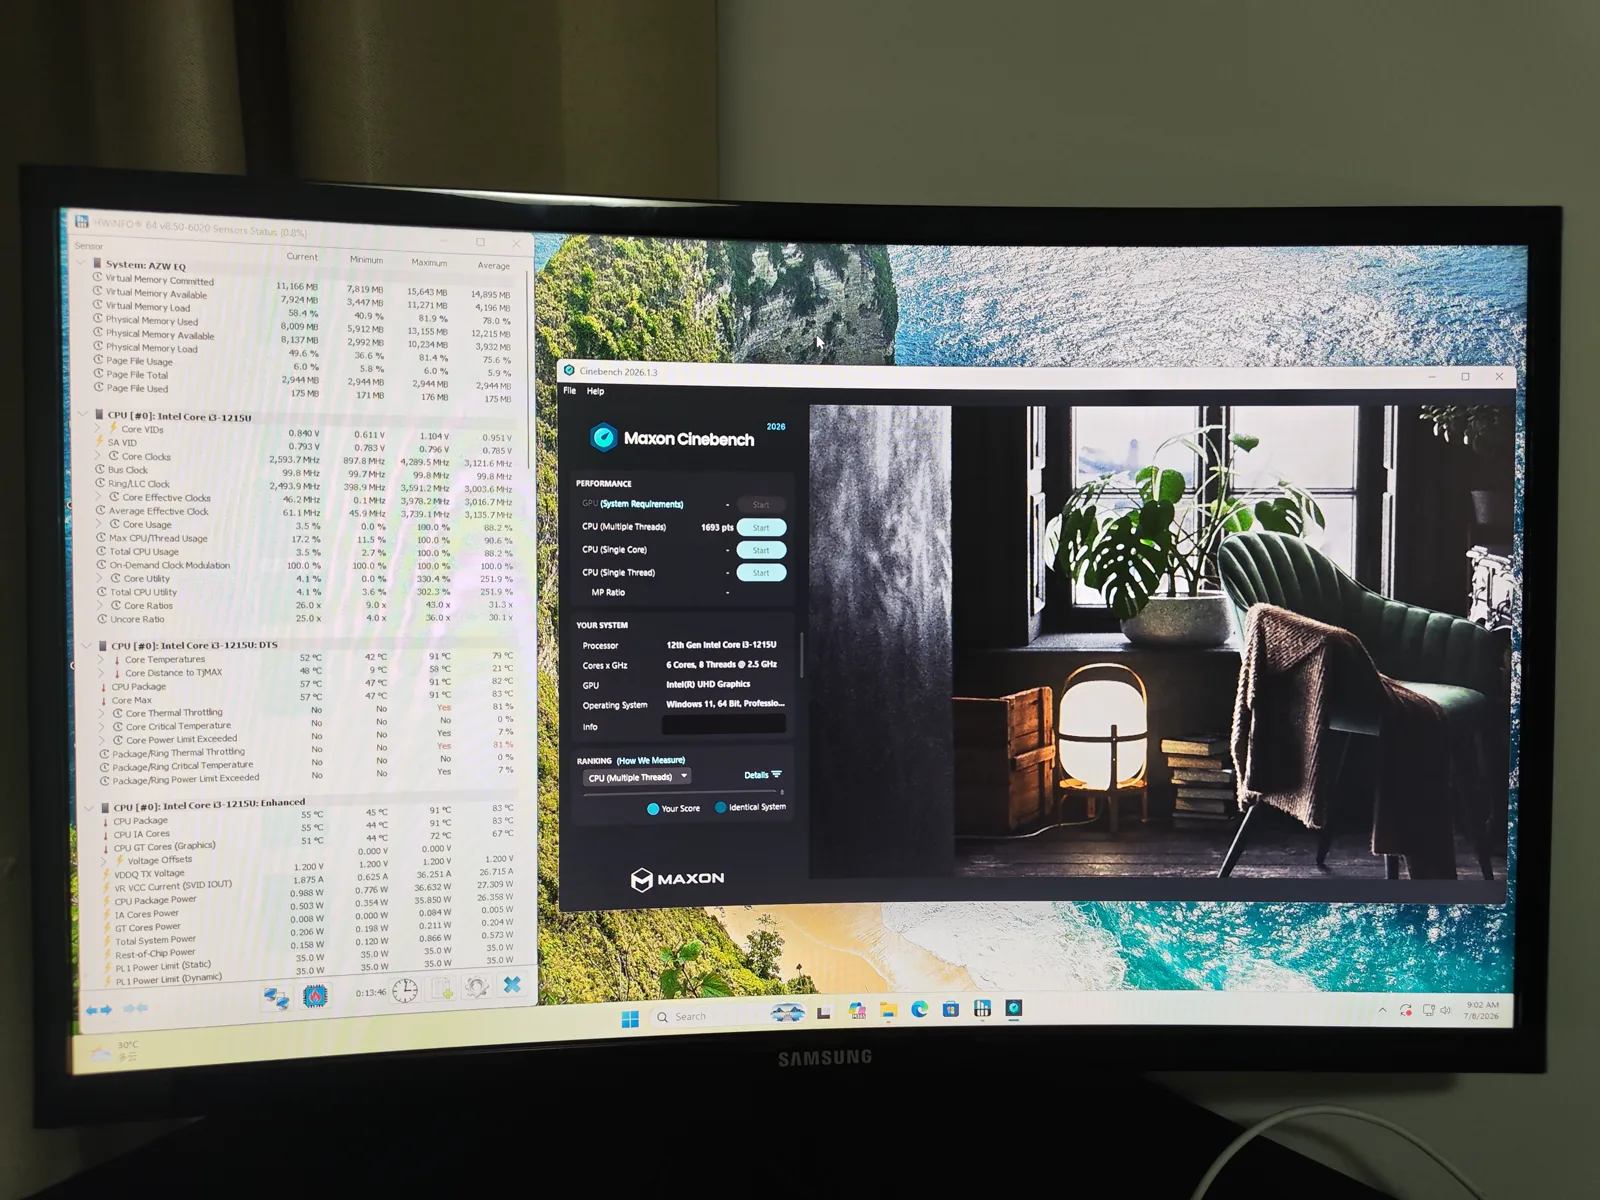
Mini PC vs desktop vs NAS: power comparison
The form factor you choose has the largest impact on annual electricity cost. Here is a realistic comparison based on published specifications and typical measured values.
| Server type | Typical idle | Typical load | Annual kWh (4h load/day) | Annual cost at $0.16/kWh |
|---|---|---|---|---|
| Mini PC (i3-class) | 10-15W | 30-45W | 110-160 kWh | $18-26 |
| Desktop (i5/i7) | 60-100W | 150-250W | 650-1,050 kWh | $104-168 |
| Tower server (Xeon) | 100-200W | 200-400W | 1,050-1,750 kWh | $168-280 |
| 2-bay NAS (ARM) | 15-25W | 30-50W | 160-230 kWh | $26-37 |
| 4-bay NAS (x86) | 30-50W | 60-100W | 330-500 kWh | $53-80 |
The mini PC is the clear winner for light-to-moderate home server workloads. A desktop server costs 5-10× more in electricity alone. Over a 5-year lifespan, that is $400-700 in saved electricity — enough to buy another mini PC.
Caveat: these are typical ranges, not guarantees. Actual power depends on the specific CPU, number of drives, workload profile, and power supply efficiency. Always measure your own setup if the number matters.
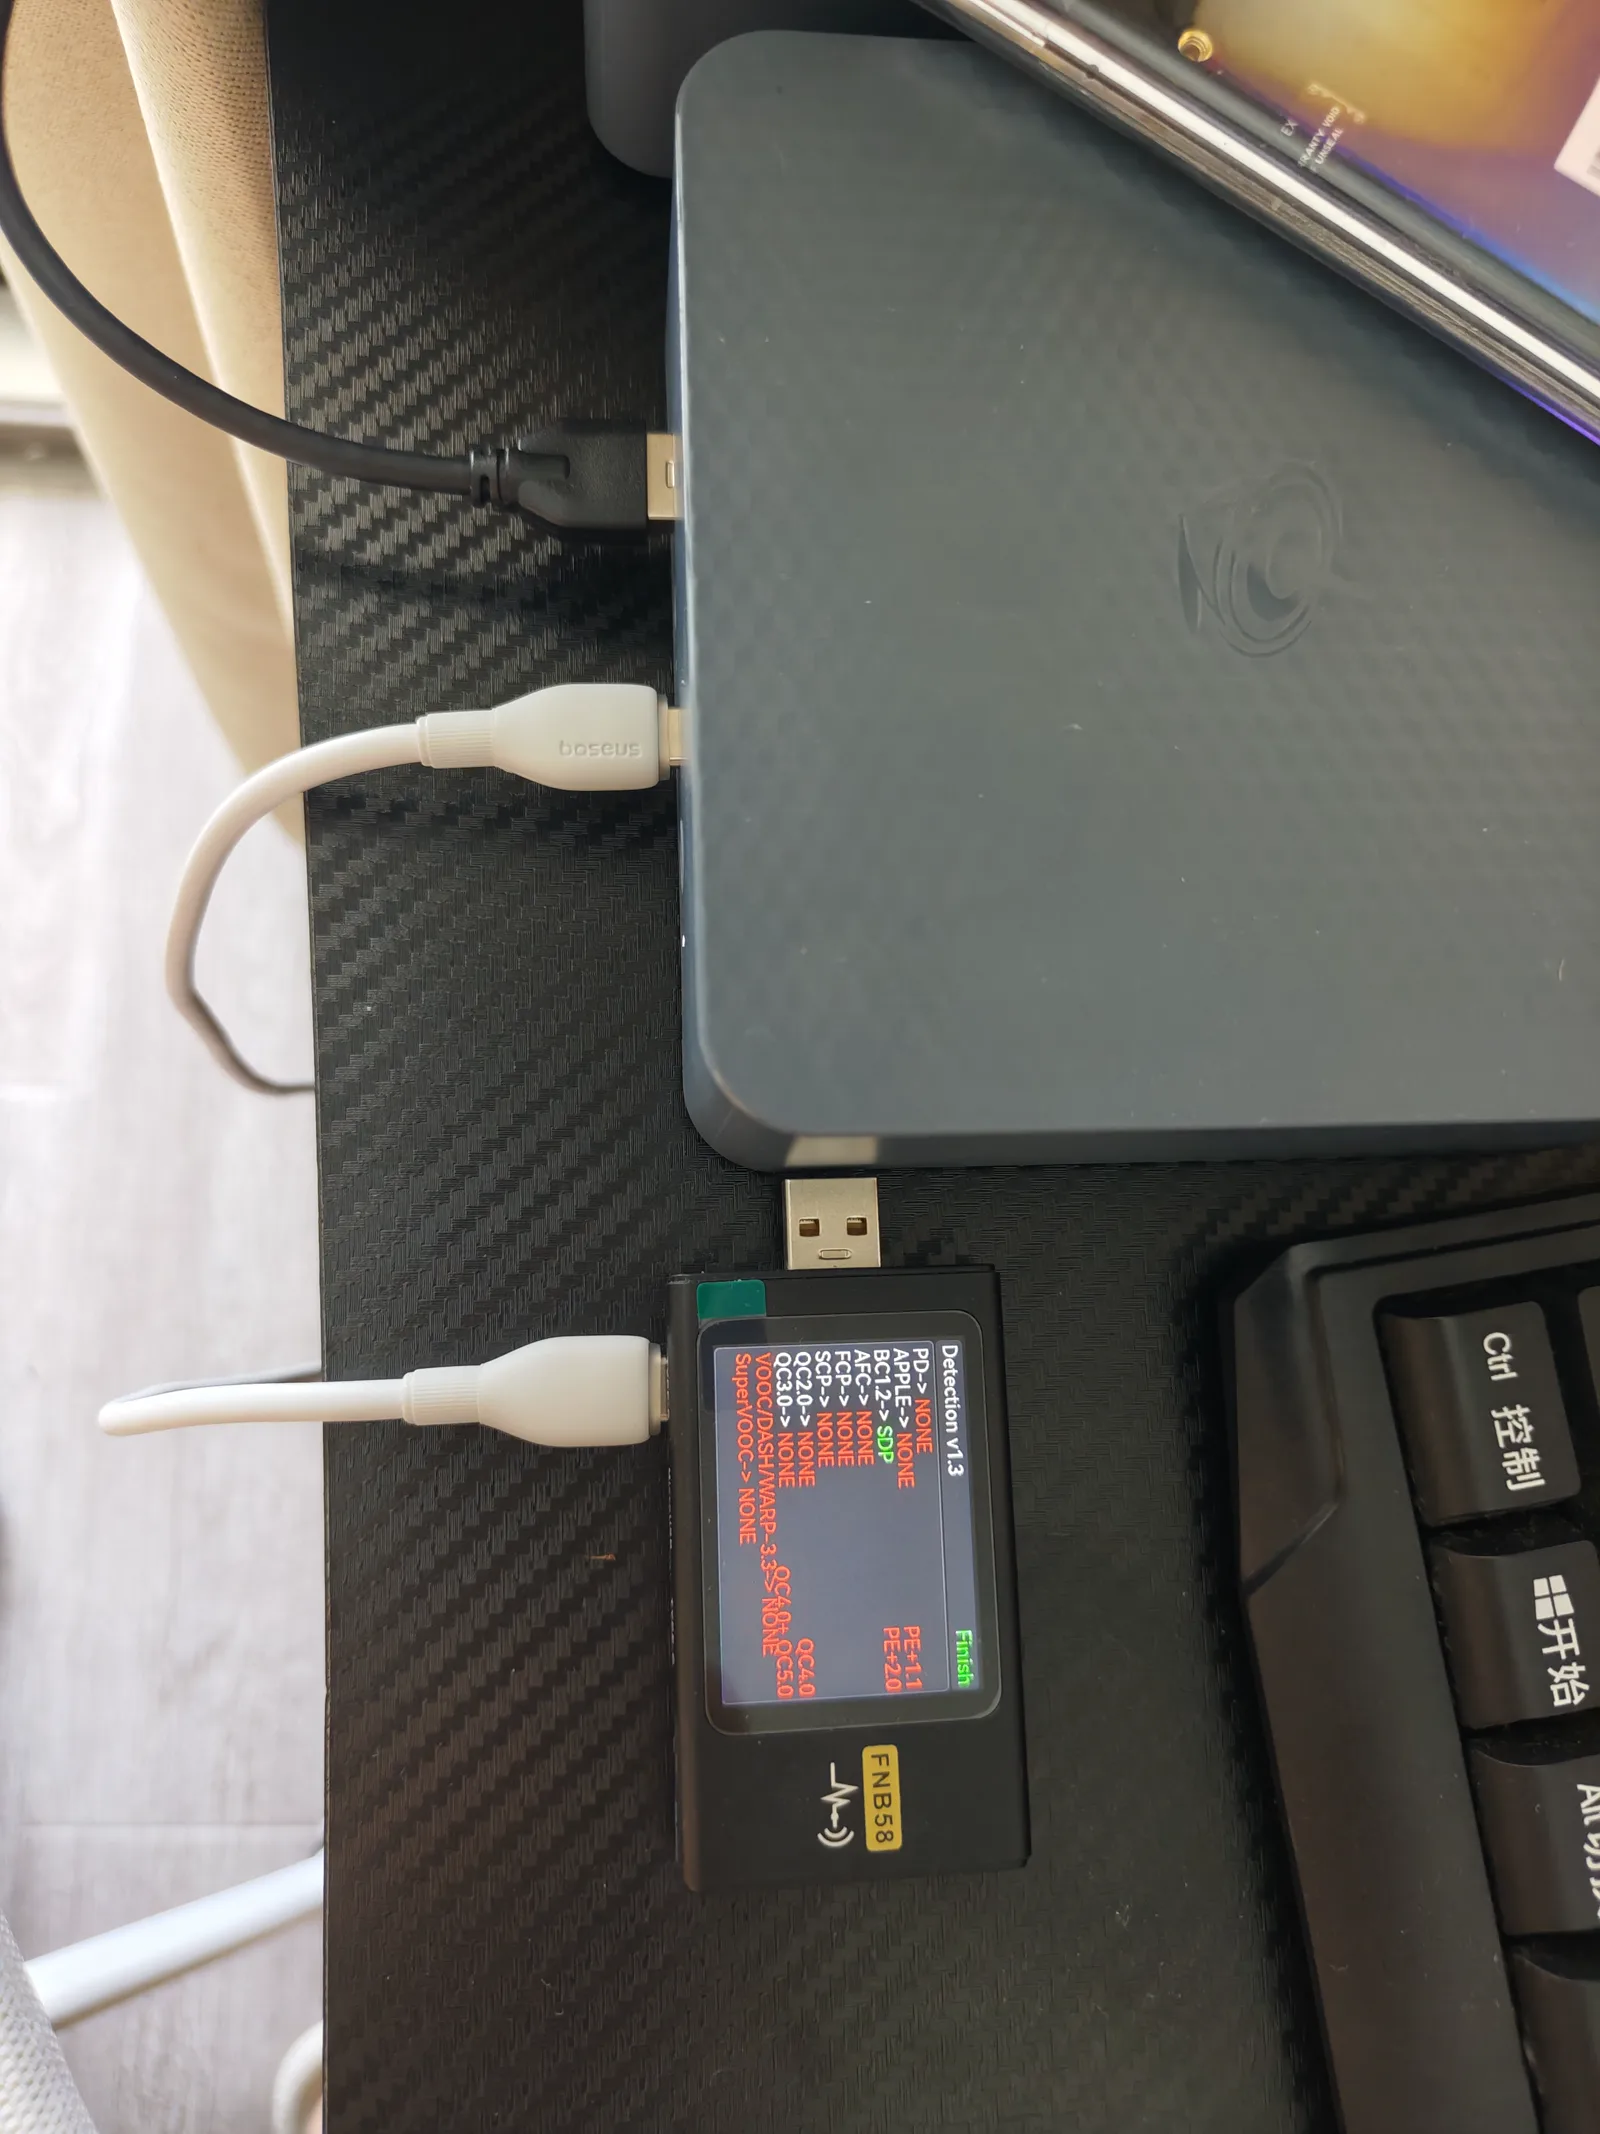
What drives power consumption in a home server
Understanding where the watts go helps you make decisions that actually reduce the bill.
CPU: the biggest variable
The processor is the single largest power consumer under load. An i3-class chip at 100% load draws 25-40W at the wall. An i7 or Xeon can draw 100-200W. For a home server that spends most of its time idle, the idle power matters more than the peak.
Intel vs AMD for home servers: Intel’s Alder Lake and later chips have efficient E-cores that handle background tasks at very low power. AMD’s recent APUs are competitive but tend to have higher idle power in mini PC implementations. The difference is small (2-5W) but compounds over 8,760 hours.
Storage: SSD vs HDD
| Storage type | Active power | Idle power | Impact |
|---|---|---|---|
| NVMe SSD | 3-7W | 0.05-0.1W | Negligible when idle |
| SATA SSD | 2-4W | 0.05-0.1W | Negligible when idle |
| 3.5” HDD | 5-8W | 3-5W | Significant if always spinning |
| 2.5” HDD | 2-4W | 1-2W | Moderate |
If your server uses spinning drives, enabling drive sleep (spindown) for volumes that are not accessed constantly can save 2-5W per drive. Over a year with three drives, that is 50-130 kWh.
The EQi12’s internal NVMe SSD drew negligible additional power beyond the base system. External USB SSDs add 1-3W depending on the enclosure.
Memory: small but real
DDR4 memory draws about 2-3W per 8GB module under load, less at idle. The EQi12’s 16GB (2 × 8GB) configuration adds roughly 3-5W to the total system power. Upgrading to 32GB would add another 2-3W — noticeable on a meter but small in annual cost terms.
Networking: nearly free
Gigabit Ethernet controllers draw 0.5-1.5W. Wi-Fi adapters draw 1-3W when active. The EQi12’s dual Realtek GbE controllers and Intel AX200 Wi-Fi together add less than 3W to the total.
Power supply efficiency
The conversion from AC to DC is never 100% efficient. A typical mini PC external power supply is 85-92% efficient. That means 8-15% of the power drawn from the wall is lost as heat before reaching the components.
For the EQi12 at 14W idle, the actual component power is roughly 12-13W, with 1-2W lost in conversion. This is already included in wall-meter readings, so no separate calculation is needed — but it explains why wall power is always higher than the sum of component specifications.
How to reduce your home server power bill
These are practical steps ordered by impact.
1. Choose efficient hardware (saves 50-80%)
The single biggest decision is the platform. A mini PC with an efficient mobile processor uses a fraction of the power of a repurposed desktop. If you are building a new server, start with the lowest-power platform that meets your needs.
2. Enable drive spindown (saves 10-30% for HDD users)
If your server has spinning drives, configure them to spin down after a period of inactivity. In Windows, use Power Options → Hard disk → Turn off hard disk after. In Linux, use hdparm -S or smartctl standby timers.
3. Use hardware transcoding for media (saves 60-70% vs software)
Our measurements showed Jellyfin QSV hardware transcoding at 13W versus 37W for sustained CPU load. If you run a media server, ensuring hardware acceleration is active is one of the highest-impact optimizations. See the Jellyfin QSV setup guide for verification steps.
4. Schedule heavy tasks during off-peak hours
If your electricity provider offers time-of-use pricing, schedule backups, updates, and batch processing during off-peak hours. The power consumption is the same, but the cost per kWh may be 30-50% lower.
5. Review running services periodically
Each Docker container adds a small baseline overhead. Services you no longer use still consume memory and occasionally wake the CPU. Run docker compose ps monthly and remove what you do not need.
6. Consider sleep or shutdown schedules
If the server does not need to be available overnight, configure a sleep schedule. The EQi12 drew about 1W in S3 sleep — a 92% reduction from the 12W Docker-idle state. Over 8 hours of nightly sleep, that saves about 26 kWh per year.
The trade-off is Wake-on-LAN reliability. Our testing showed shutdown WOL at 5/5 and S3 sleep WOL at 4/5. See the WOL troubleshooting guide for the complete diagnostic path.
Common misconceptions about server power
“My CPU is 15W TDP, so my server uses 15W”
TDP describes the processor’s thermal design point under a specific workload, not the complete system. The actual wall power includes memory, storage, networking, and conversion loss. Expect 30-50% more than the CPU TDP for a complete mini PC system at idle.
“Docker uses a lot of extra power”
Our measurements showed Docker services idle at 12W versus Windows idle at 14W. The containers themselves use negligible power when not processing requests. The Docker engine adds minimal overhead. Power increases only when containers handle real workloads.
“SSDs use more power than HDDs”
Active SSDs draw similar or slightly more power than active HDDs. But SSDs spend most of their time idle at 0.05-0.1W, while HDDs idle at 3-5W if spinning. For a home server with bursty access patterns, SSDs are significantly more efficient overall.
“I need a UPS, which adds to the power bill”
A UPS does add 5-15W of conversion loss depending on the model and load. However, it protects against data corruption during power events. The cost is small ($10-25/year) compared to the risk of filesystem damage. Treat it as insurance, not waste.
Worked examples with real numbers
Example 1: Light home server (file sharing + Home Assistant)
- Idle: 12W (22 hours/day)
- Light load: 18W (2 hours/day for backups and updates)
- Electricity rate: $0.16/kWh
Average watts = (12 × 22 + 18 × 2) ÷ 24 = 12.5W
Annual kWh = 12.5 × 24 × 365 ÷ 1,000 = 109.5 kWh
Annual cost = 109.5 × 0.16 = $17.52
Example 2: Media server (Jellyfin with nightly transcoding)
- Idle: 12W (20 hours/day)
- QSV transcoding: 13W (2 hours/day)
- CPU load (backup): 37W (2 hours/day)
- Electricity rate: $0.16/kWh
Average watts = (12 × 20 + 13 × 2 + 37 × 2) ÷ 24 = 14.8W
Annual kWh = 14.8 × 24 × 365 ÷ 1,000 = 129.6 kWh
Annual cost = 129.6 × 0.16 = $20.74
Example 3: Heavy home server (multiple VMs + databases)
- Idle: 40W (18 hours/day)
- Moderate load: 80W (4 hours/day)
- Peak load: 150W (2 hours/day)
- Electricity rate: $0.16/kWh
Average watts = (40 × 18 + 80 × 4 + 150 × 2) ÷ 24 = 55.8W
Annual kWh = 55.8 × 24 × 365 ÷ 1,000 = 488.8 kWh
Annual cost = 488.8 × 0.16 = $78.21
Use the Power Cost Calculator to run your own scenario. It handles the math and supports multiple currencies.
What this does not include
These estimates cover the server unit only. They do not include:
- Network equipment — switches, routers, and access points add 5-30W depending on the setup
- External storage — each external drive enclosure adds 2-8W
- UPS conversion loss — typically 5-15W depending on the model and load
- Display output — if the server drives a monitor, add 20-50W for the display
- Time-of-use pricing — the calculation uses a flat rate; real bills may vary by hour
- Taxes and delivery charges — electricity bills include fixed charges beyond the per-kWh rate
For a complete home lab power budget, measure the entire protected group (server + switch + UPS) at the wall.
Next steps
- Use the Power Cost Calculator — enter your own measurements for a personalized estimate
- Read the seven-state power report — the complete EQi12 measurement data
- Jellyfin QSV setup guide — ensure hardware transcoding is active to minimize media power
- Docker Compose starter stack — build an efficient server with measured resource usage